
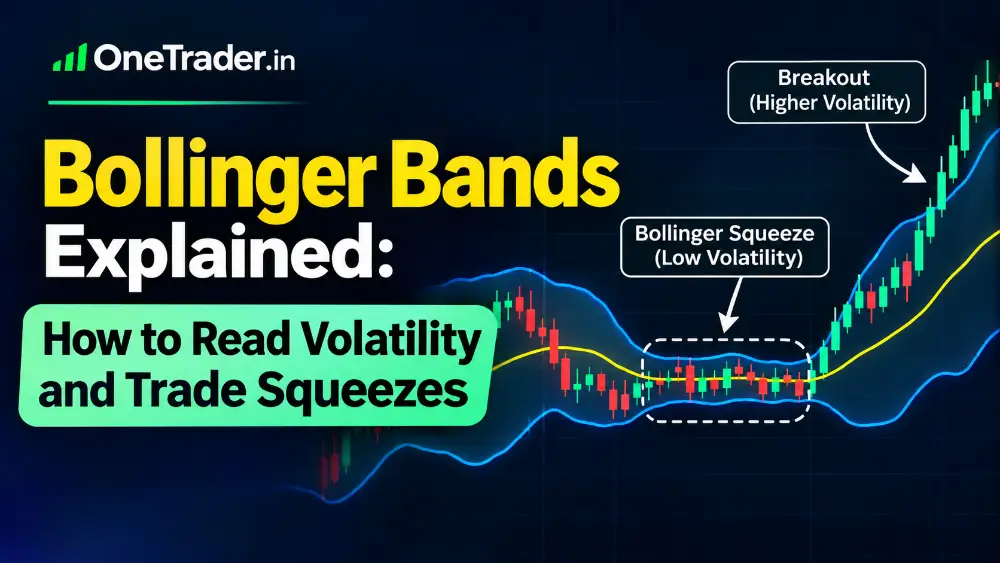
Bollinger Bands are among the most widely used indicators in technical analysis. They help traders understand market volatility, identify periods of price contraction and expansion, and assess whether a stock is trading relatively high or low compared with its recent price behaviour.
Unlike indicators that focus primarily on momentum or trend direction, Bollinger Bands adapt to changing market conditions. This makes them particularly useful for identifying potential breakouts, spotting overextended price movements and understanding when a market may be preparing for a significant move.
In simple words
Bollinger Bands consist of three lines around a stock’s price. When the bands become narrow, volatility is low and a breakout may be approaching. When they expand, volatility is increasing. The bands help traders study price behaviour, but they do not predict which direction the market will move.
Also Read: Moving Averages: How to Use SMA and EMA for Stock Trading
What Are Bollinger Bands?
Bollinger Bands are a volatility-based technical indicator developed by John Bollinger. The indicator consists of three lines plotted around a price chart.
The middle line represents a moving average, while the upper and lower bands are calculated using standard deviations from that average.
The commonly used settings are a 20-period Simple Moving Average (SMA) and two standard deviations.
| Component | Calculation |
|---|---|
| Middle Band | 20-period SMA |
| Upper Band | SMA + 2 standard deviations |
| Lower Band | SMA – 2 standard deviations |
Traders can adjust these settings depending on their trading timeframe and strategy, but the default configuration is a practical starting point.
Also Read: Patrick Nill’s 3-Touch Strategy: What Robbins World Cup Traders Can Teach Beginners
How to Read Bollinger Bands
Each band provides different information about price behaviour.
Upper Band: Represents the upper volatility boundary. When prices approach or move above this band, the stock may be experiencing strong buying pressure or an extended upward move.
Middle Band: Acts as a dynamic reference level. It is the 20-period moving average and can help traders assess the prevailing short-term trend.
Lower Band: Represents the lower volatility boundary. Prices approaching this band may indicate selling pressure or an extended downward move.

Also Read: MACD Indicator: How to Use MACD for Stock Trading
A common mistake is assuming that touching the upper band automatically signals a sell and touching the lower band signals a buy. In a strong trend, prices can continue moving along either band for several candles.
What Is a Bollinger Band Squeeze?
The Bollinger Band Squeeze is one of the most popular trading setups based on this indicator.
A squeeze occurs when the upper and lower bands move closer together, indicating that market volatility has contracted. Price movements become relatively smaller, and the stock enters a period of consolidation.
Such periods can precede a sharp price movement as volatility returns.
Also Read: RSI Indicator: How to Use RSI for Stock Trading
However, a squeeze does not guarantee an immediate breakout or indicate its direction. The stock may break upward, downward or remain sideways for longer than expected.
How traders approach a squeeze:
- Identify a period when the bands become unusually narrow compared with their recent behaviour.
- Mark the consolidation range and important support and resistance levels.
- Wait for a decisive candle closing outside the consolidation range.
- Look for volume expansion and confirmation from price action.
- Consider entering after a confirmed breakout, with a stop-loss based on the setup’s invalidation level.
How to Trade Bollinger Band Breakouts
Bollinger Band breakouts are generally more useful when combined with price action and volume.
| Trading signal | What to observe |
|---|---|
| Bullish breakout | Price closes above the upper band with strong momentum |
| Bearish breakout | Price closes below the lower band with selling pressure |
| Volume confirmation | Trading volume increases during the breakout |
| Retest | Price revisits the breakout area and holds it |
| Failed breakout | Price quickly returns inside the previous range |
For a bullish setup, traders can look for a candle closing above resistance after a squeeze, preferably with increased volume. A successful retest of the breakout level can offer another entry opportunity.
Also Read: Support and Resistance Trading Strategy: A Complete Beginner’s Guide
For a bearish setup, the opposite conditions apply. A decisive close below support, supported by selling volume, can indicate a potential downside move.
Waiting for candle-close confirmation helps reduce false breakout entries.
Bollinger Bands in Trending and Sideways Markets
The same indicator behaves differently depending on market conditions.
| Market condition | Bollinger Band behaviour | Interpretation |
|---|---|---|
| Strong uptrend | Price frequently follows upper band | Sustained buying pressure |
| Strong downtrend | Price frequently follows lower band | Sustained selling pressure |
| Sideways market | Price moves between bands | Potential range-bound conditions |
| Low volatility | Bands contract | Consolidation or squeeze |
| High volatility | Bands expand | Larger price movements |
In a sideways market, traders may study the upper and lower bands for potential reversal opportunities. In a trending market, repeatedly selling near the upper band or buying near the lower band can be risky.
Also Read: What Are Futures and Options?
Bollinger Bandwidth and %B Explained
Two additional measurements can help traders interpret Bollinger Bands more precisely.
Bollinger Bandwidth measures the distance between the upper and lower bands relative to the middle band. A declining bandwidth indicates contracting volatility, while an increasing bandwidth indicates expanding volatility.
Bollinger %B identifies where the current price stands relative to the bands.
| %B reading | Interpretation |
|---|---|
| Above 1 | Price is above the upper band |
| 1 | Price is at the upper band |
| 0.5 | Price is at the middle band |
| 0 | Price is at the lower band |
| Below 0 | Price is below the lower band |
These measurements are useful for comparing volatility conditions and understanding price positioning without relying only on visual observation.
Also Read: Day Trading in India: A Beginner’s Guide to Intraday Stock Trading
Best Indicators to Combine With Bollinger Bands
Bollinger Bands work better when combined with indicators that provide additional confirmation.
| Indicator | How it helps |
|---|---|
| RSI | Evaluates momentum and potential divergence |
| Volume | Confirms buying or selling participation |
| VWAP | Helps assess intraday price positioning |
| MACD | Provides momentum and trend confirmation |
| Support and Resistance | Identifies important breakout levels |
For example, a Bollinger Band squeeze followed by a resistance breakout, rising volume and bullish RSI momentum can provide a stronger trading setup than a band breakout alone.
Common Mistakes to Avoid
Traders should avoid treating Bollinger Bands as standalone buy and sell signals.
- Selling immediately when price touches the upper band.
- Buying immediately when price touches the lower band.
- Assuming every squeeze will produce a strong breakout.
- Entering before the candle closes beyond the breakout level.
- Ignoring volume and important support and resistance levels.
- Using identical settings for every market and timeframe without testing.
Bollinger Bands are based on historical price and volatility. They cannot guarantee future price movements or eliminate trading risk.
Also Read: Volume Profile Trading Strategy for Better Trading
Key Takeaways
- Bollinger Bands measure market volatility using a moving average and standard deviations.
- The standard setting is a 20-period SMA with two standard deviations.
- Narrow bands indicate volatility contraction and can help identify potential squeeze setups.
- A squeeze does not predict breakout direction.
- Volume, candle closes and support and resistance levels improve breakout confirmation.
- Prices can continue following the upper or lower band during strong trends.
- Combining Bollinger Bands with price action and other indicators can improve trading decisions.
Financial Disclaimer: This article is intended for educational purposes only and should not be considered investment advice or a recommendation to buy or sell any security. Technical indicators are not guaranteed to predict market movements. Trading and investing involve financial risk, and readers should conduct their own research and consult a qualified financial adviser before making investment decisions.


Keep learning with OneTrader
Explore structured lessons and practical guides to build your market knowledge.

Need a laugh after all that money talk?
Paisa LOL: India's funniest finance page, with memes, comics, jokes and long funny stories.