
Strategies
Strategy #2: Trend Line Trading Strategy – How to Identify Trends, Entries and Breakouts
Trend line trading is one of the simplest ways to understand market direction without depending on multiple technical indicators. Whether…

Trend line trading is one of the simplest ways to understand market direction without depending on multiple technical indicators. Whether…

The Moving Average Convergence Divergence (MACD) is one of the most widely followed momentum indicators in technical analysis. It helps…
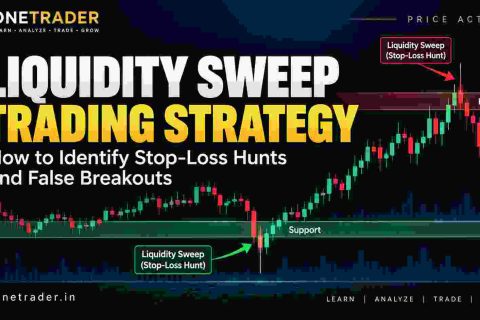
Learn how liquidity sweeps work, how to identify false breakouts around swing highs and lows, and how to manage risk with price action.

The Relative Strength Index, commonly known as RSI, is one of the most widely used technical indicators in stock trading.…
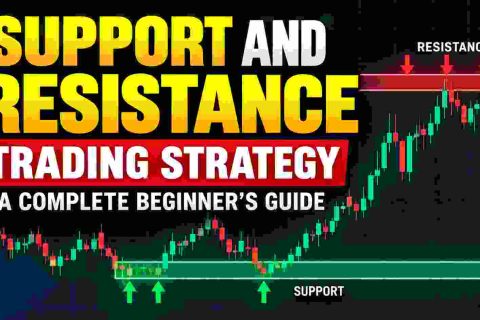
Support and resistance are among the most important concepts in technical analysis and form the foundation of many trading strategies.…

Introduction Successful stock trading is rarely about finding a magical indicator or predicting every market move correctly. In Trade Like…

Introduction Candlestick patterns are one of the most important foundations of price action trading. Every candle tells a story about…

A breakout is one of the most important price-action events in technical trading. When price moves beyond a well-defined resistance…

Finding good stocks in the Indian market can be difficult because there are thousands of listed companies. Going through every…

📘 Onetrader Futures & Options (F&O) Series — Complete Index 🎯 Series Goal To simplify complex F&O concepts into easy,…
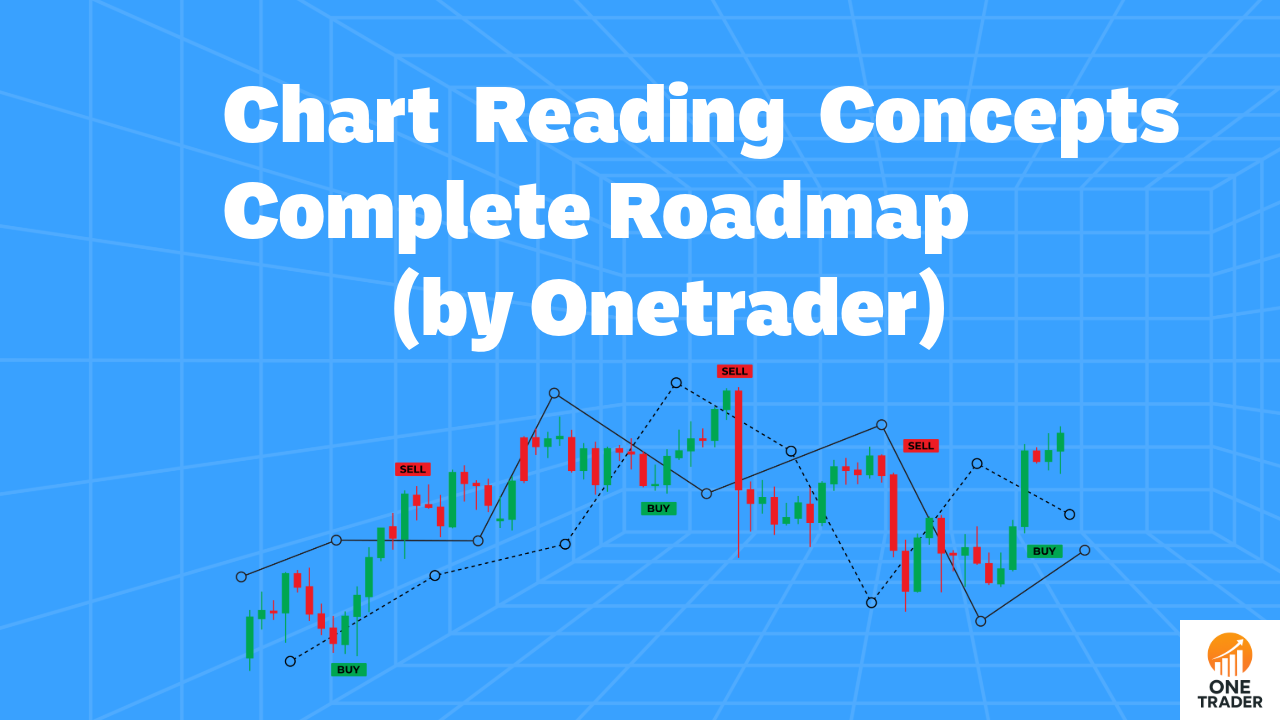
📘 Chart Reading Concepts – Complete Roadmap 🧭 Introduction Reading stock charts is the foundation of successful trading. Whether you’re…
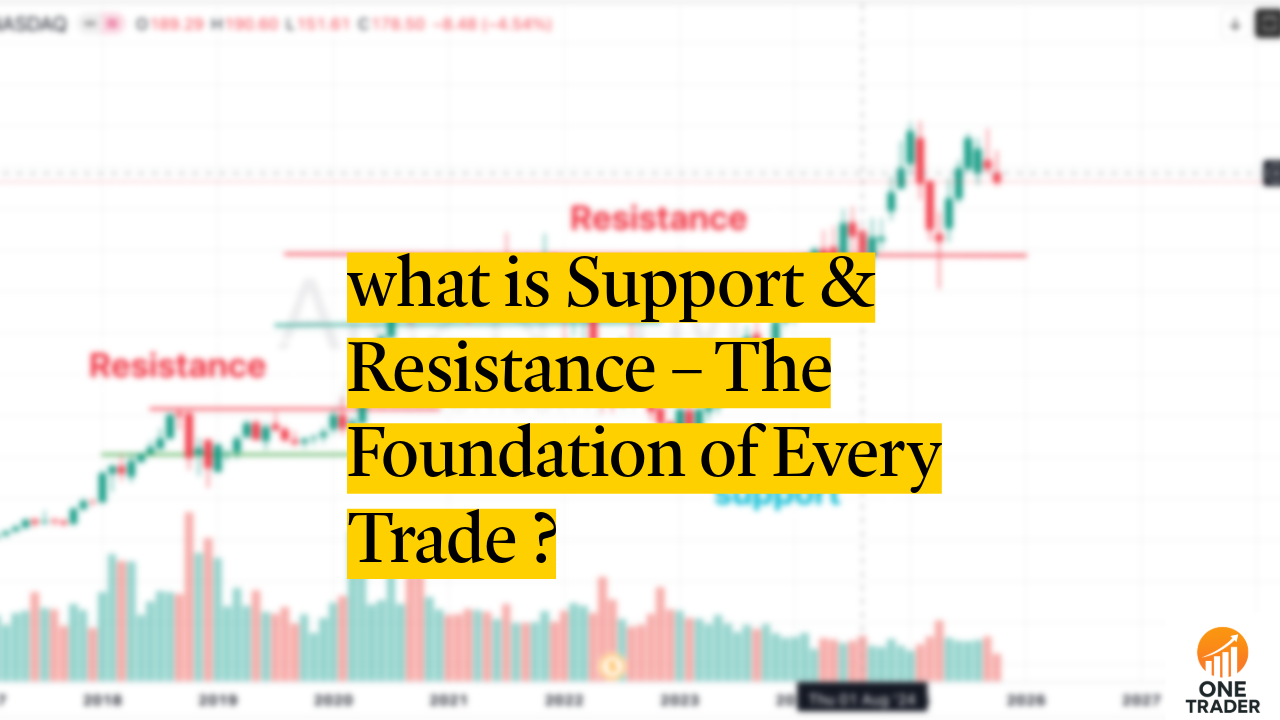
🧠 What is Support & Resistance? Explained With Charts By Onetrader Guide 📈 Introduction Every trader hears the words support…