
Fundamental Analysis
View More → Fundamental Analysis Latest
Operating Margin vs Net Margin: What Each One Tells You About a Company
Understand the difference between operating margin and net margin, how to calculate both ratios, and what they reveal about a company's profitability.
Read More

How to Analyze Earnings Per Share (EPS) Before Buying a Stock
A company announces a 25% increase in net profit, and its stock attracts attention. At first glance, the results look…

How to Analyze Revenue Growth Before Investing in Stocks
Learn how to analyze company revenue growth, organic sales, volume growth and profitability to identify sustainable business growth in stocks.

Free Cash Flow Explained: Why It Matters in Fundamental Stock Analysis
Learn what free cash flow means, how to calculate it, and why FCF matters for evaluating company financial health, stock valuation and business quality.
Technical Analysis
View More →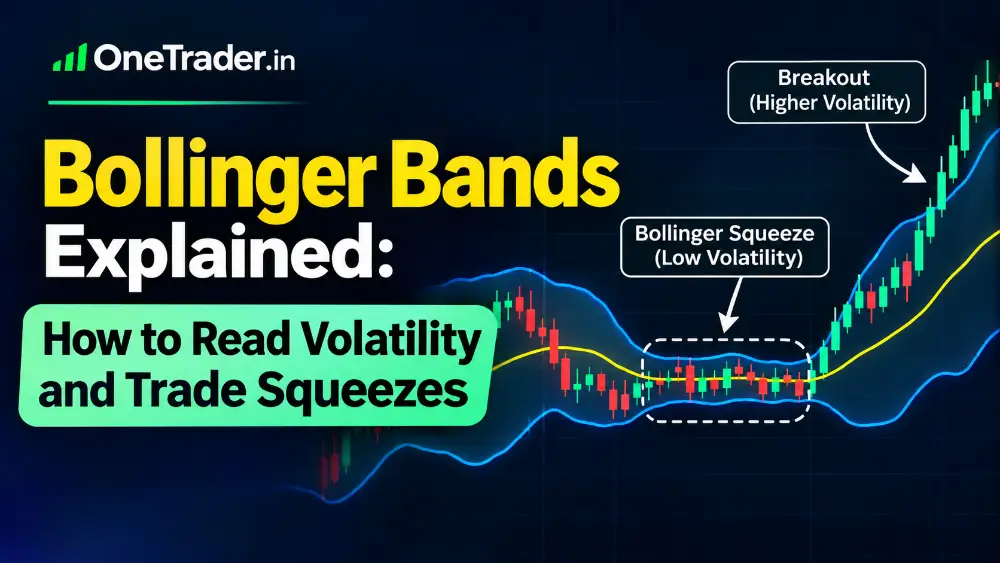 Technical Analysis Latest
Bollinger Bands Explained: How to Read Volatility and Trade Squeezes
Learn how Bollinger Bands work, understand volatility contraction and expansion, identify Bollinger Band squeezes, and trade potential breakouts using price action and volume confirmation.
Read More
Moving Averages: How to Use SMA and EMA for Stock Trading
Moving averages are among the most widely used indicators in technical analysis. They help traders understand the direction of a…

Patrick Nill’s 3-Touch Strategy: What Robbins World Cup Traders Can Teach Beginners
Learn Patrick Nill's 3-touch strategy, including entries, stops, targets, market conditions and lessons for Nifty and Bank Nifty traders.

MACD Indicator: How to Use MACD for Stock Trading
The Moving Average Convergence Divergence (MACD) is one of the most widely followed momentum indicators in technical analysis. It helps…
Price Action
View More →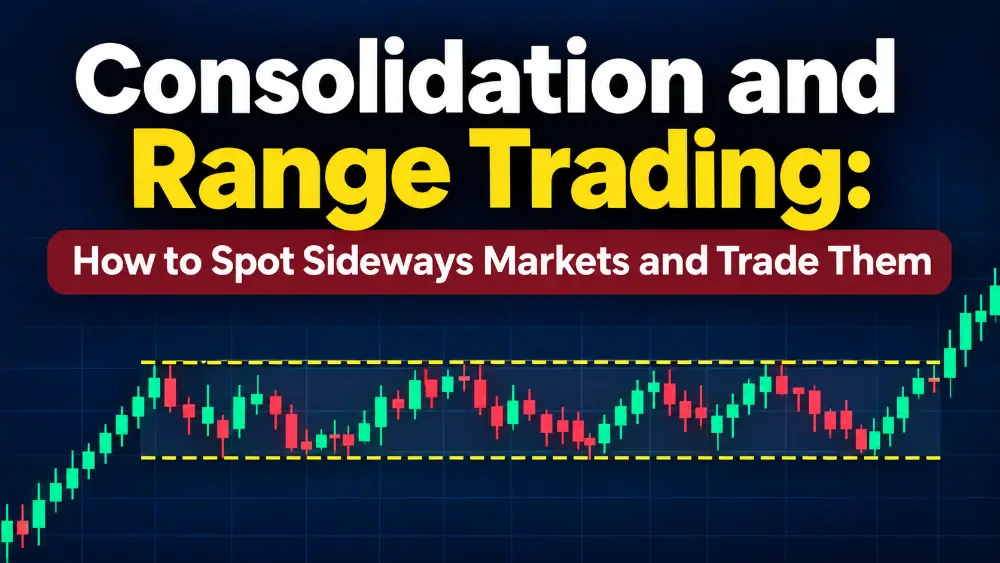 Price Action Latest
Consolidation and Range Trading: How to Spot Sideways Markets and Trade Them
Learn how to identify sideways markets, draw support and resistance zones, use technical indicators and trade consolidation ranges with proper risk management.
Read More
Opening Range Breakout Strategy: Rules, Entry, Stop-Loss and Common Mistakes
Learn the Opening Range Breakout strategy with practical entry rules, stop-loss placement, target calculation, breakout confirmation and common mistakes for intraday traders.
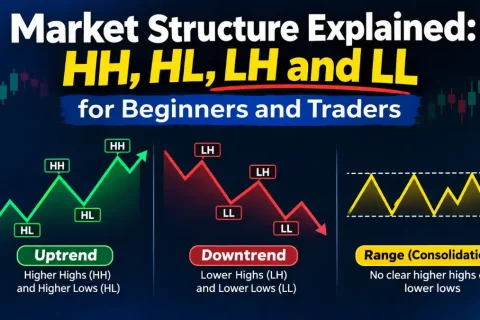
Market Structure Explained: HH, HL, LH and LL
Learn how Higher Highs, Higher Lows, Lower Highs and Lower Lows help identify market trends, recognise reversals and understand price action.

Sector-Wise ETF Swing Trading Strategy: 5% Target, 5% Stop Loss and Bulk Buying Plan
OneTrader | Swing Trading Strategies Introduction Swing trading does not always require selecting individual stocks. Another approach is to identify…
OneTrader Posts
View More → OneTrader Posts Latest
How to Read a Contract Note from Your Stockbroker: Charges, Taxes and Settlement Explained
Learn how to read a stockbroker contract note, understand brokerage, STT, GST, stamp duty, DP charges and India's T+1 settlement process.
Read More

How to Choose a Financial Advisor: 7 Things to Check Before Hiring One
Choosing a financial advisor is an important decision because the person you hire may influence how you invest, prepare for…

How to Change Bank Account in Demat Account Online: Step-by-Step Guide
Changing your bank account linked to a Demat account is an important process when you switch banks, close an old…

OneTrader Weekend News Wrap: Indian Markets Rebound, Wall Street Slumps as Oil, Inflation and AI Concerns Dominate
Saturday, October 17, 2026 | OneTrader.in | Weekend Market & Economic News Indian stock markets delivered their strongest weekly recovery…