
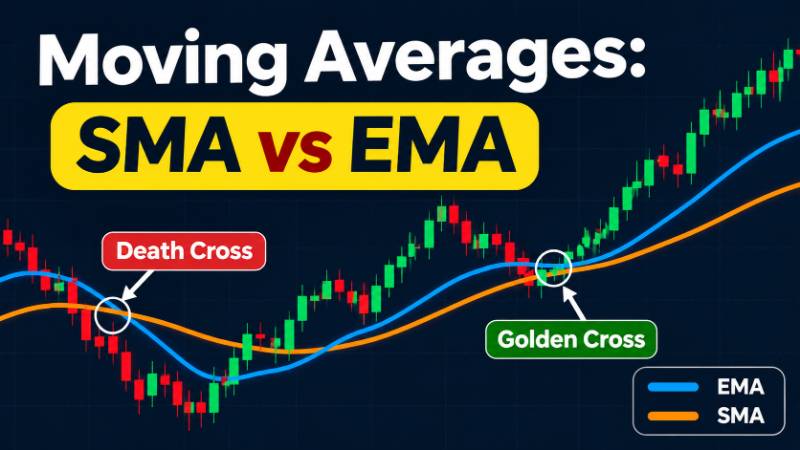
Moving averages are among the most widely used indicators in technical analysis. They help traders understand the direction of a stock’s trend by smoothing out short-term price fluctuations. Whether analysing individual stocks, the Nifty or Bank Nifty, moving averages can help identify trends, potential reversals and areas where buying or selling pressure may emerge. Two commonly used types are the Simple Moving Average (SMA) and Exponential Moving Average (EMA). Understanding how they work and when to use them can make chart analysis more structured.
How Moving Averages Work
A moving average calculates the average closing price of a security over a selected number of candles. As a new candle forms, the oldest observation is removed from the calculation and the latest price is included. This is why it is called a moving average.
For example, a moving average on a daily chart considers daily closing prices, while one on an hourly chart considers hourly closing prices. The selected period determines how many candles are included in the calculation.
Moving averages smooth out price fluctuations and make the broader trend easier to identify. When the price consistently trades above a moving average, it can indicate bullish momentum. When it remains below the average, it may indicate bearish momentum.
Also Read: Patrick Nill’s 3-Touch Strategy: What Robbins World Cup Traders Can Teach Beginners
However, moving averages are lagging indicators. They use historical prices, so they cannot predict future movements. Their primary purpose is to help traders understand the existing trend rather than forecast exactly where the market will move next.
SMA vs EMA
The two most commonly used moving averages are the Simple Moving Average (SMA) and Exponential Moving Average (EMA). Both calculate average prices, but they differ in how much importance they give to recent price movements.
The SMA gives equal weight to every closing price within the selected period. The EMA gives greater importance to recent prices, making it respond more quickly when the market changes direction.
| Feature | SMA | EMA |
|---|---|---|
| Full form | Simple Moving Average | Exponential Moving Average |
| Calculation | Equal weight to all prices | Greater weight to recent prices |
| Price sensitivity | Slower response | Faster response |
| Best suited for | Understanding broader trends | Tracking shorter-term momentum |
| Common usage | Long-term trend analysis | Intraday and swing trading |
Neither indicator is universally better. The choice depends on the trader’s strategy, timeframe and preference.
Also Read: MACD Indicator: How to Use MACD for Stock Trading
For example, a trader analysing the long-term direction of a stock may prefer an SMA, while someone looking for quicker changes in momentum may use an EMA.
Popular Moving Average Periods (50, 100, 200 and Shorter Ones)
Moving average periods determine how much historical price data the indicator considers. Different periods serve different purposes, and traders often combine them to understand both short-term and long-term trends.
The 50-period moving average is commonly used to identify the medium-term trend. When a stock consistently trades above it, traders may interpret this as a sign of positive momentum. A sustained move below it can indicate weakening price strength.
The 100-period moving average provides a broader view of the trend. It can help traders understand whether a stock’s medium-term direction is changing or remaining stable.
Also Read: RSI Indicator: How to Use RSI for Stock Trading

The 200-period moving average is widely followed for long-term trend analysis. Many traders use it to assess the broader market direction and identify whether a stock is maintaining its longer-term strength.
Shorter moving averages, such as the 9-period, 10-period and 20-period averages, respond more quickly to price changes. They are often used to study short-term momentum, particularly in intraday and swing trading.
The selected period should always match the chart timeframe. A 50-period moving average on a daily chart represents a different duration from a 50-period moving average on a five-minute chart.
Moving Average Crossovers (Golden Cross and Death Cross)
Moving average crossovers occur when one moving average crosses another. Traders use these signals to identify possible changes in market direction.
Also Read: Support and Resistance Trading Strategy: A Complete Beginner’s Guide
A golden cross occurs when a shorter-term moving average crosses above a longer-term moving average. It is generally considered a bullish signal because it suggests that recent price momentum is improving relative to the longer-term trend.
A death cross occurs when a shorter-term moving average crosses below a longer-term moving average. It is generally considered a bearish signal because it indicates weakening momentum.
For example, traders analysing the Nifty or individual stocks may observe these crossovers to understand whether the broader trend is strengthening or weakening.
However, crossovers are not reliable in every market condition. During sideways markets, moving averages can repeatedly cross each other, generating false signals.
Also Read: What Are Futures and Options?
Traders should therefore examine the overall price structure, trading volume and broader trend before acting on a crossover. Waiting for price confirmation can help reduce the risk of reacting to temporary movements.
Using Moving Averages as Dynamic Support and Resistance
Support and resistance levels are usually identified through price action, but moving averages can also act as dynamic support and resistance.
Unlike traditional horizontal support and resistance levels, moving averages continuously change as new prices enter the calculation.
During an uptrend, a stock may repeatedly move towards a rising moving average and find buying interest around it. Traders may interpret this behaviour as dynamic support.
Also Read: Day Trading in India: A Beginner’s Guide to Intraday Stock Trading
During a downtrend, the price may approach a falling moving average and face selling pressure. In this situation, the moving average may act as dynamic resistance.
However, these reactions are not guaranteed. Price can move through a moving average without reversing, particularly when momentum is strong.
An important point is that traders should not treat every moving average touch as a trading opportunity. The reaction around the average matters more than the touch itself.
Look for supporting evidence such as rejection candles, strong price reactions, trend structure and volume behaviour before considering a trade.
Also Read: Volume Profile Trading Strategy for Better Trading
Using Moving Averages for Intraday and Swing Trading
Moving averages can be applied to different trading styles, but their usage changes depending on the timeframe.
Intraday trading: Intraday traders commonly use shorter EMAs to understand immediate price direction and momentum. On Nifty and Bank Nifty charts, traders may observe whether prices are trading above or below these averages to assess the prevailing intraday trend.
A combination of price action and moving averages can help traders avoid taking trades against the immediate market direction. However, moving averages should not replace entry confirmation, stop-loss planning or risk management.
Swing trading: Swing traders generally focus on daily charts to identify trends that may continue over several trading sessions. Medium-term and longer-term moving averages can help them understand the broader direction of a stock.
For example, a swing trader may look for stocks maintaining an upward trend above an important moving average and then study pullbacks for potential entry opportunities.
The key is to use moving averages as a supporting tool rather than treating them as standalone buy or sell signals. Price action, support and resistance, volume and overall market conditions should also be considered.
Common Moving Average Mistakes Traders Should Avoid
Although moving averages are easy to apply, traders can make several mistakes when interpreting their signals. Understanding these limitations is important for using the indicator effectively.
- Using too many moving averages: Adding several moving averages to a chart can create confusion. Focus on a small combination that supports your trading strategy.
- Treating every crossover as a signal: A crossover does not guarantee a trend reversal. Confirm the signal through price action and the broader market structure.
- Ignoring sideways markets: Moving averages work better when a clear trend exists. In range-bound conditions, frequent crossovers can generate misleading signals.
- Using the wrong timeframe: A moving average selected for intraday trading may not be suitable for long-term analysis. Match the period with your trading timeframe.
- Entering trades without confirmation: A price touching or crossing a moving average is not sufficient confirmation. Observe how the price behaves around it.
- Ignoring stop-loss and risk management: Even a well-supported moving average signal can fail. Every trade should have a predefined exit plan.
- Assuming moving averages predict the future: Moving averages are calculated using historical prices. They help identify existing trends but cannot guarantee what happens next.
The most effective approach is to understand what a moving average is showing, identify the market condition and combine its signals with price action instead of relying on the indicator alone.
Disclaimer: This article is intended for educational and informational purposes only and does not constitute investment advice, trading advice or a recommendation to buy or sell securities. Technical indicators, including moving averages, can generate false signals, and past market performance does not guarantee future results. Onetrader is not a SEBI-registered investment adviser. Readers should conduct independent research and consult a qualified financial professional before making investment or trading decisions.



Keep learning with OneTrader
Explore structured lessons and practical guides to build your market knowledge.

Need a laugh after all that money talk?
Paisa LOL: India's funniest finance page, with memes, comics, jokes and long funny stories.