
 Technical Analysis Latest
MACD Indicator: How to Use MACD for Stock Trading
The Moving Average Convergence Divergence (MACD) is one of the most widely followed momentum indicators in technical analysis. It helps traders examine changes in price momentum, identify potential…
Read More
Category: Technical Analysis
Technical Analysis Latest
MACD Indicator: How to Use MACD for Stock Trading
The Moving Average Convergence Divergence (MACD) is one of the most widely followed momentum indicators in technical analysis. It helps traders examine changes in price momentum, identify potential…
Read More

Technical Analysis
RSI Indicator: How to Use RSI for Stock Trading
The Relative Strength Index, commonly known as RSI, is one of the most widely used technical indicators in stock trading.…

Technical Analysis
Support and Resistance Trading Strategy: A Complete Beginner’s Guide
Support and resistance are among the most important concepts in technical analysis and form the foundation of many trading strategies.…

Technical Analysis
What Are Futures and Options?
Futures and Options, commonly called F&O, are financial contracts whose value is derived from an underlying asset such as a…

Technical Analysis
Day Trading in India: A Beginner’s Guide to Intraday Stock Trading
Day trading, also called intraday trading, involves buying and selling stocks within the same trading session. Unlike long-term investing, the…
Technical Analysis
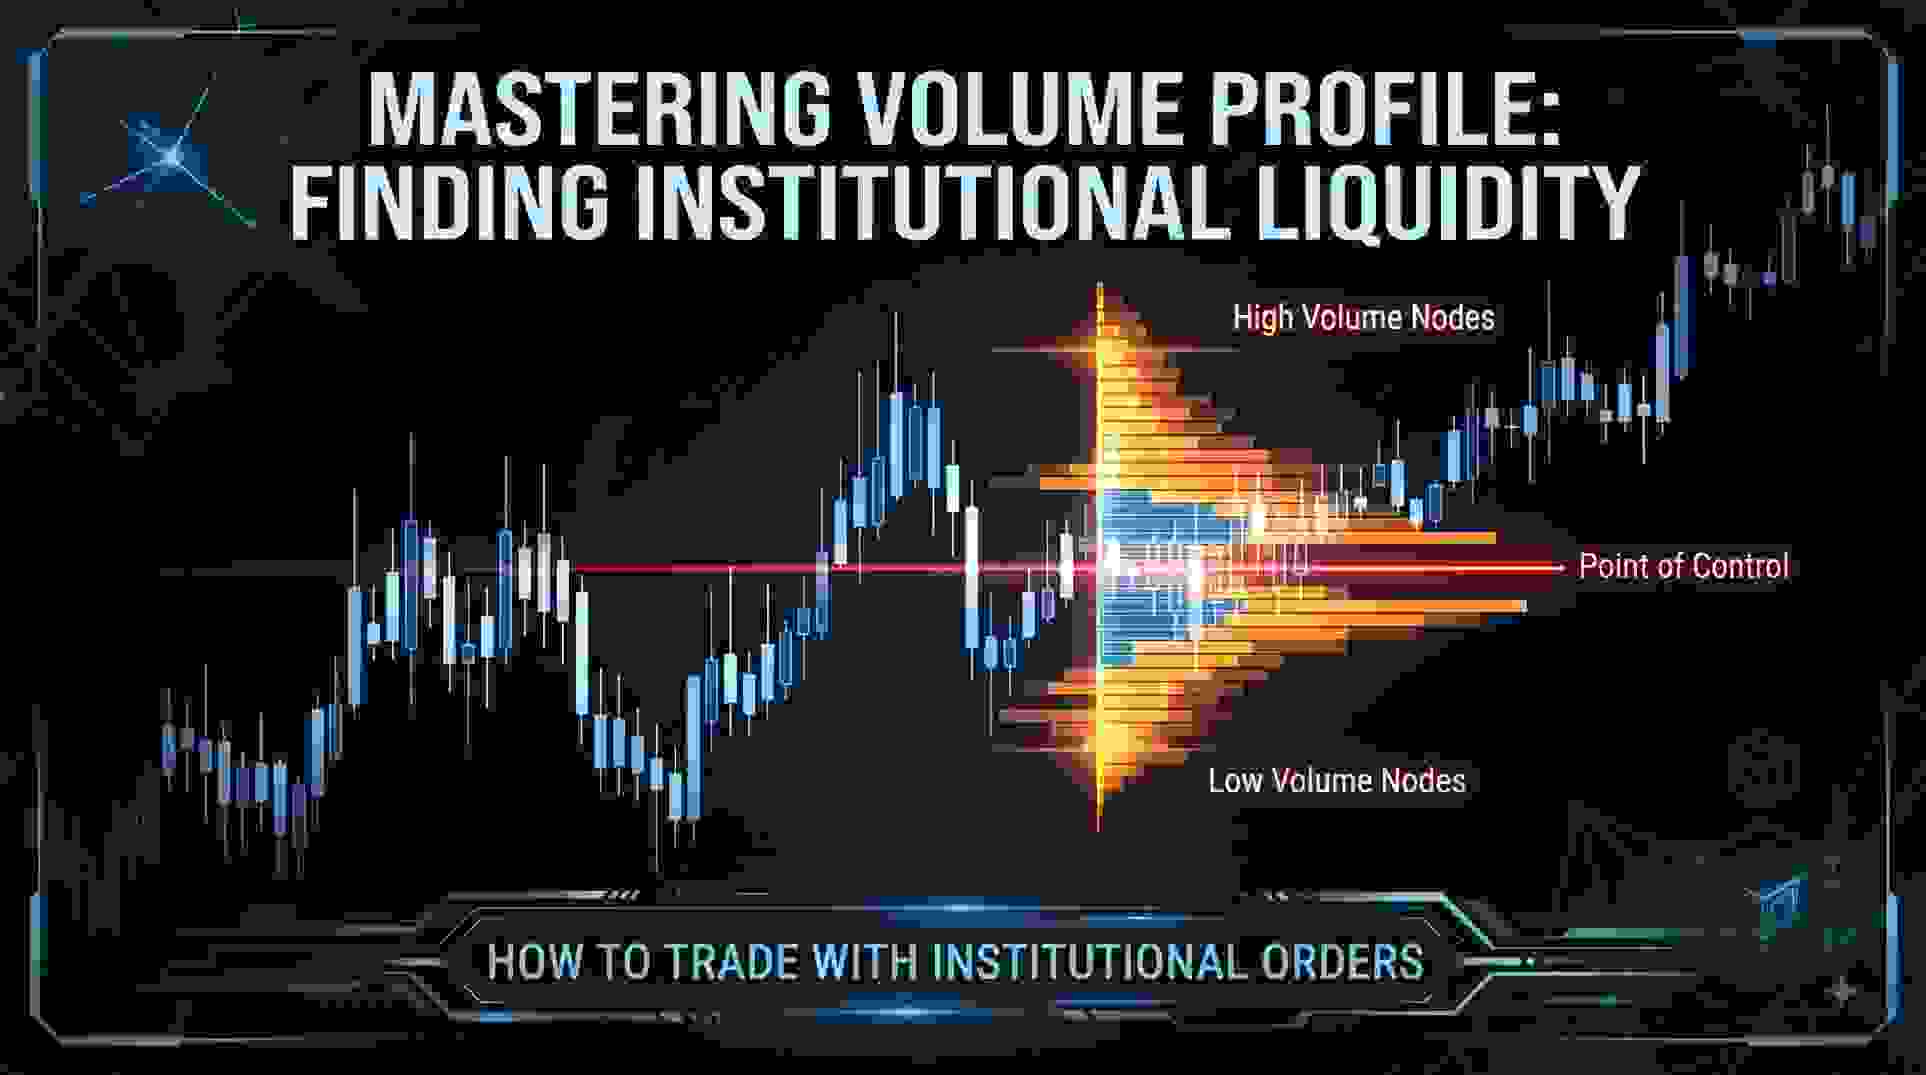
Volume Profile Trading Strategy for Better Trading
For most retail traders, analyzing price action alone is like looking at a car's dashboard without knowing how fast the…