
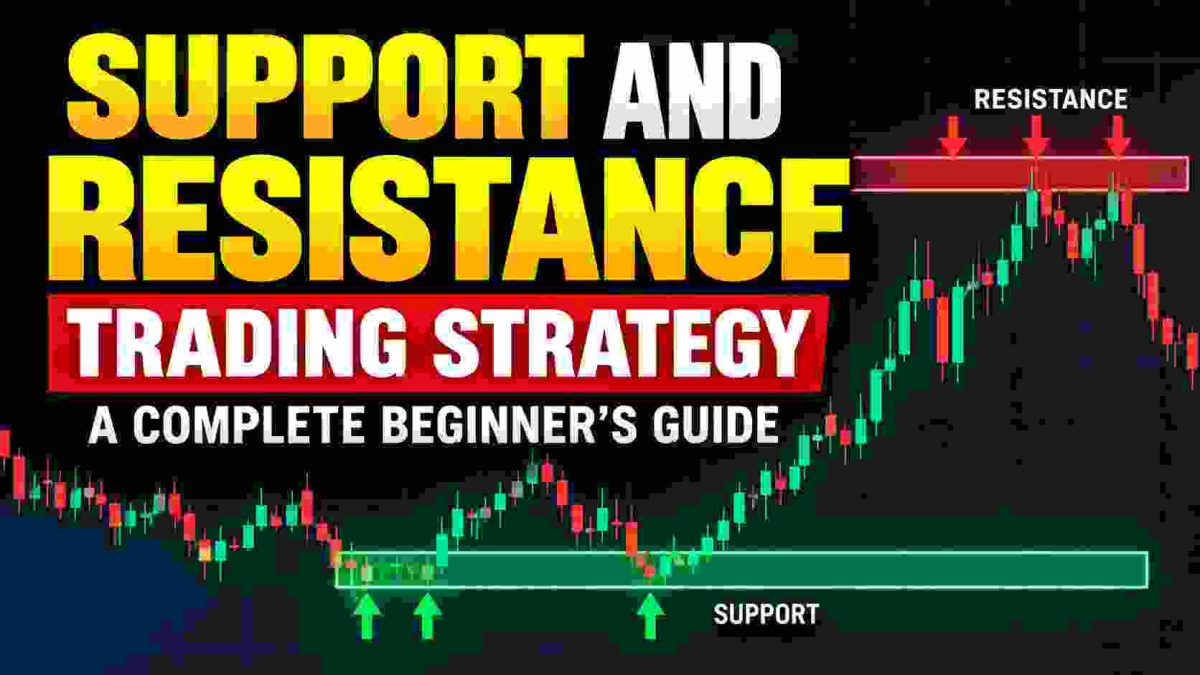
Support and resistance are among the most important concepts in technical analysis and form the foundation of many trading strategies. Whether a trader is analysing stocks, Nifty, Bank Nifty or other financial instruments, understanding these levels can help identify where price may react, consolidate or change direction. However, support and resistance should not be treated as guaranteed reversal points. They are areas where buying and selling interest has previously influenced price, giving traders an important reference for planning their trades.
What Is Support in Trading?
Support is a price area where a falling market has previously found buying interest and started moving higher. When price approaches the same area again, traders pay attention because buyers may become active once more. For example, if a stock repeatedly falls toward ₹500 and then recovers, the ₹500 region can become an important support zone. This does not mean the stock must rise from ₹500 every time. Instead, it means the area has demonstrated buying interest in the past and deserves closer observation.
Support is particularly useful when it occurs around a previous swing low, a major consolidation area or a level that has produced several meaningful reactions. The stronger and more visible the historical reaction, the more relevant the area can become.
What Is Resistance in Trading?
Resistance is the opposite of support. It is a price area where an advancing market has previously encountered selling pressure and struggled to move higher. If a stock repeatedly reaches ₹600 and then declines, the ₹600 region becomes an important resistance zone.
Also Read: Intraday vs Delivery Trading: What Is the Difference?
Resistance can help traders identify areas where an existing long position may face selling pressure or where a potential short setup may develop, depending on the trader’s strategy and market segment. Just like support, resistance is not an exact ceiling. Price can move slightly above the area before reversing, or it can break through the level and establish a new trading range.
Support and Resistance Are Zones, Not Exact Lines
One of the most important lessons for beginners is that support and resistance should generally be viewed as zones rather than perfectly precise prices. Markets rarely reverse at exactly the same number on every occasion. A stock that previously reacted around ₹500 might react at ₹495 or ₹505 when it revisits the area.
Instead of forcing every reaction onto a single line, traders can identify a broader area containing the important highs, lows and candle reactions. This makes the analysis more realistic and prevents traders from entering or exiting a position simply because price moved a few points above or below an arbitrary line.
How to Identify Strong Support and Resistance
Previous swing highs and swing lows are among the simplest places to begin. A significant swing low where price changed direction can become a potential support area, while a meaningful swing high can become resistance. Levels that have produced multiple reactions can become more noticeable to market participants.
Also Read: How to Sell Shares in India
Higher-timeframe charts are particularly useful for identifying important levels. A support zone visible on a daily or weekly chart generally provides broader context than a minor level appearing only on a five-minute chart. Intraday traders can therefore begin their analysis on a higher timeframe and then move to a lower timeframe to look for an entry.
However, traders should avoid marking every small turning point. Too many levels can make a chart confusing and encourage unnecessary trades. The objective is to identify the most relevant areas around which price has demonstrated meaningful behaviour.
How to Trade Support and Resistance
A basic support-and-resistance setup involves waiting for price to approach an important zone and then observing the reaction. When price reaches support, a trader may look for evidence that selling pressure is weakening and buyers are becoming active. This could include a strong rejection candle, a change in short-term market structure or a move back above a nearby price level.
Similarly, when price reaches resistance, a trader can observe whether buyers are able to push through the zone or whether selling pressure begins to appear. Waiting for confirmation can help prevent the common mistake of entering a trade simply because price touched a support or resistance level.
Also Read: What Are Futures and Options?
The stop-loss should be placed at a logical point where the original trade idea becomes invalid. The target should be based on the next meaningful support or resistance area rather than an arbitrary number. This approach allows the trader to define the potential risk and reward before entering the position.
What Happens When Support or Resistance Breaks?
Support and resistance do not always hold. A strong move through a level can change the market structure and create a potential breakout opportunity. When resistance is decisively broken, the previous resistance area may later act as support. Likewise, when support breaks, that area can potentially become resistance during a subsequent recovery.
This is known as a role reversal. However, traders should be careful with false breakouts. Price can temporarily move beyond a level and then quickly return inside the previous range. Waiting for a strong close, sustained movement or a retest can provide additional confirmation, depending on the trading strategy.
Common Mistakes Beginners Should Avoid
The biggest mistake is assuming that every support level must produce a bounce and every resistance level must produce a fall. Markets are dynamic, and levels can fail. Another common mistake is drawing too many lines, entering without confirmation and placing stop-losses based on emotions rather than market structure.
Also Read: Day Trading in India: A Beginner’s Guide to Intraday Stock Trading
Traders should also avoid ignoring the broader trend. A support level during a powerful downtrend may break more easily than expected, while resistance during a strong uptrend may eventually be overcome. Support and resistance work best when combined with an understanding of trend, price structure, volume and overall market conditions.
Risk Management Is More Important Than the Level
Even a well-identified support or resistance zone can fail. Therefore, the quality of risk management matters more than trying to find a perfect level. Before entering a trade, a trader should know the entry price, invalidation point, potential target and position size.
A good setup can still result in a loss, which is why traders should avoid risking an excessive portion of their capital on a single trade. The objective is not to predict every market movement correctly but to ensure that individual losses remain manageable while profitable trades have enough room to compensate for them.
Final Takeaway
Support and resistance provide traders with a simple framework for understanding where price has previously encountered significant buying or selling interest. Their real value comes from combining these areas with market structure, trend, confirmation and disciplined risk management.
Also Read: Volume Profile Trading Strategy for Better Trading
Instead of thinking, “Support means buy” or “Resistance means sell,” think of these levels as areas where you should pay closer attention. The market’s reaction at the level provides the information needed to decide whether a trade exists. With practice, support and resistance can become one of the most useful foundations for learning price action, breakout trading, pullbacks and other technical trading strategies.
Disclaimer: This article is for educational and informational purposes only and should not be considered investment or financial advice. Trading involves risk, and past price behaviour does not guarantee future results.
Also Read: How FII and DII Flows Impact the Stock Market – onetrader