
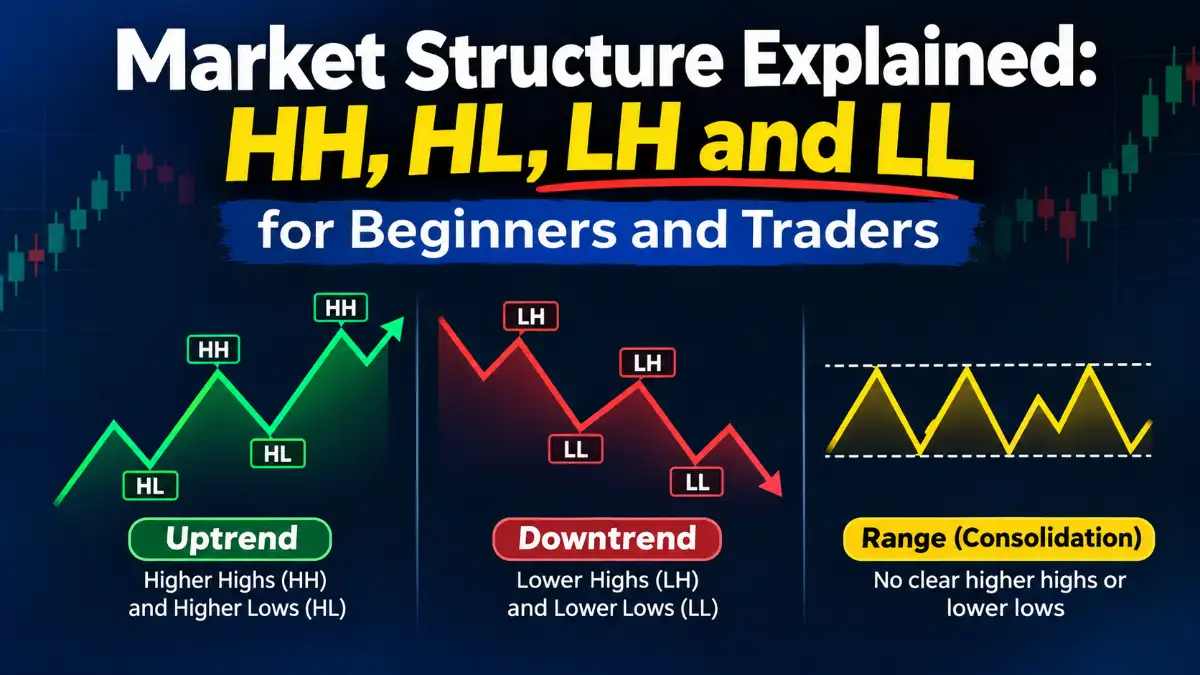
Market structure is one of the foundations of technical analysis. It helps traders understand whether buyers or sellers are controlling the market and whether an existing trend is continuing or weakening.
By studying four basic formations, Higher Highs (HH), Higher Lows (HL), Lower Highs (LH) and Lower Lows (LL), traders can identify trends, recognise potential reversals and understand important price movements without depending entirely on indicators.
In Simple Words
Market structure is the pattern created by successive price highs and lows. Higher Highs and Higher Lows indicate an uptrend, while Lower Highs and Lower Lows indicate a downtrend. When neither pattern develops consistently, the market may be moving sideways.
Understanding HH, HL, LH and LL
These four formations describe how the latest swing high or low compares with the previous one.
Also Read: Pullback Trading Strategy: How to Trade Trend Retracements Using Price Action
| Term | Meaning | What it indicates |
|---|---|---|
| HH | Higher High | Price moves above the previous swing high |
| HL | Higher Low | Price holds above the previous swing low |
| LH | Lower High | Price fails to reach the previous swing high |
| LL | Lower Low | Price falls below the previous swing low |
The important point is to identify these formations as a sequence. An individual higher high or lower low does not necessarily establish a trend.
How to Identify an Uptrend
An uptrend develops when price consistently creates Higher Highs and Higher Lows.
For example, a stock rises from ₹100 to ₹110, corrects to ₹105, advances to ₹116 and then pulls back to ₹111 before moving higher again.
| Price movement | Structure |
|---|---|
| ₹100 to ₹110 | Initial high |
| Pullback to ₹105 | HL |
| Rise to ₹116 | HH |
| Pullback to ₹111 | HL |
| Rise to ₹122 | HH |
The pattern shows buyers are willing to purchase at increasingly higher prices. Even when selling pressure appears, the price does not fall below the previous important swing low.
Also Read: How to Choose a Financial Advisor: 7 Things to Check Before Hiring One
A higher low is particularly important because it represents an area where buyers previously regained control.
How to Identify a Downtrend
A downtrend develops when price consistently forms Lower Highs and Lower Lows.
Consider a stock falling from ₹200 to ₹190, recovering to ₹195, declining to ₹183, recovering to ₹189 and then falling to ₹178.
| Price movement | Structure |
|---|---|
| ₹200 to ₹190 | Initial decline |
| Recovery to ₹195 | LH |
| Fall to ₹183 | LL |
| Recovery to ₹189 | LH |
| Fall to ₹178 | LL |
This pattern indicates selling pressure. Each recovery fails below the previous swing high, while sellers continue pushing prices to fresh lows.
Also Read: How to Change Bank Account in Demat Account Online: Step-by-Step Guide

A bullish candle or temporary recovery within this structure does not automatically indicate a trend reversal.
Uptrend vs Downtrend vs Sideways Market
Markets generally display three broad structural conditions.
| Market condition | Price structure | Confirmation | What challenges it |
|---|---|---|---|
| Uptrend | HH + HL | Fresh highs and defended higher lows | Break below an important HL |
| Downtrend | LH + LL | Fresh lows and rejected lower highs | Break above an important LH |
| Sideways | Repeated highs and lows within a range | Price respects support and resistance boundaries | Sustained breakout with follow-through |
In a sideways market, buyers and sellers are relatively balanced. Price repeatedly moves between support and resistance without establishing a consistent directional trend.
Traders should recognise this condition rather than forcing an uptrend or downtrend interpretation.
How Does Market Structure Change?
Market structure is also useful for identifying potential trend reversals.
Consider an established uptrend. Price creates successive higher highs and higher lows, but eventually fails to make another meaningful higher high. If it subsequently breaks below the previous important higher low, the bullish structure is weakened.
Similarly, in a downtrend, price may stop creating fresh lower lows. A subsequent break above an important lower high suggests that buyers may be gaining control.
| Existing trend | Potential warning | Structural development |
|---|---|---|
| Uptrend | Failure to create a fresh HH | Break below important HL |
| Downtrend | Failure to create a fresh LL | Break above important LH |
These structural breaks are commonly discussed as a Change of Character (CHoCH) or Market Structure Shift (MSS).
Also Read: Liquidity Sweep Trading Strategy: How to Identify Stop-Loss Hunts and False Breakouts
However, a single break does not confirm a complete reversal. Stronger evidence develops when price establishes a new structure in the opposite direction. For example, a bullish reversal becomes more convincing when price breaks a lower high, forms a higher low and subsequently creates a higher high.
What Is Break of Structure (BOS)?
A Break of Structure occurs when price moves beyond an important previous swing level, generally in the direction of the prevailing trend.
- In an uptrend, breaking the previous swing high can confirm bullish continuation.
- In a downtrend, breaking the previous swing low can confirm bearish continuation.
Traders should examine whether price closes beyond the level and maintains the move. A temporary move above resistance followed by a sharp decline may be a false breakout or liquidity sweep rather than a genuine structural breakout.
The quality of the breakout matters more than simply seeing price cross a previous high or low.
Also Read: Can You Have Multiple Demat Accounts in India? Rules, Benefits & Charges
Why Multiple Timeframes Matter
Market structure can look different across timeframes.
For example, a stock may be in a daily uptrend while experiencing a short-term downtrend on its 15-minute chart. The shorter-term decline could simply be a pullback within the larger trend.
A practical timeframe approach is:
| Timeframe | Purpose |
|---|---|
| Daily | Identify the broader trend |
| 1-hour | Understand intermediate structure |
| 15-minute | Study trading setups |
| 5-minute | Refine short-term entries |
Understanding the higher-timeframe direction helps traders avoid interpreting every short-term correction as a major reversal.
Also Read: How to Calculate Your Stock Market Returns: Absolute Return vs CAGR vs XIRR
Common Mistakes
1. Marking every small swing: Minor candle movements are not always meaningful structural points. Focus on important price turning points.
2. Treating one lower low as a confirmed downtrend: A temporary move below a previous low may be a liquidity sweep. Look for follow-through.
3. Buying every higher high: A higher high indicates bullish structure, not necessarily an attractive entry. Avoid chasing extended price movements.
4. Confusing pullbacks with reversals: A correction within an uptrend does not automatically establish a downtrend. Watch whether an important higher low breaks.
Also Read: Why Do Stock Markets Crash? The Real Reasons Behind Market Crashes
5. Ignoring higher timeframes: A short-term bullish pattern may develop inside a larger bearish structure. Always consider the broader market direction.
Key Takeaways
- HH and HL indicate an uptrend, while LH and LL indicate a downtrend.
- Sideways markets move within relatively defined price boundaries.
- Important swing highs and lows help identify structural support and resistance.
- A break of an important swing level can signal a potential trend change.
- BOS generally indicates continuation, while CHoCH or MSS describes a possible structural shift.
- One breakout or structural break does not guarantee a reversal.
- Multiple-timeframe analysis provides better context for interpreting price movements.
Market structure teaches traders to understand what price is doing instead of reacting to individual candles. Once these four formations become familiar, analysing pullbacks, breakouts, EMA strategies and potential reversals becomes more systematic.
Financial Disclaimer
This article is for educational and informational purposes only and does not constitute investment advice or a recommendation to buy or sell any financial instrument. Technical analysis cannot predict future market movements with certainty. Trading involves financial risk. Always conduct independent research and follow appropriate risk management practices.
Also Read: How to Build a Diversified Investment Portfolio in India






Keep learning with OneTrader
Explore structured lessons and practical guides to build your market knowledge.

Need a laugh after all that money talk?
Paisa LOL: India's funniest finance page, with memes, comics, jokes and long funny stories.