
Introduction
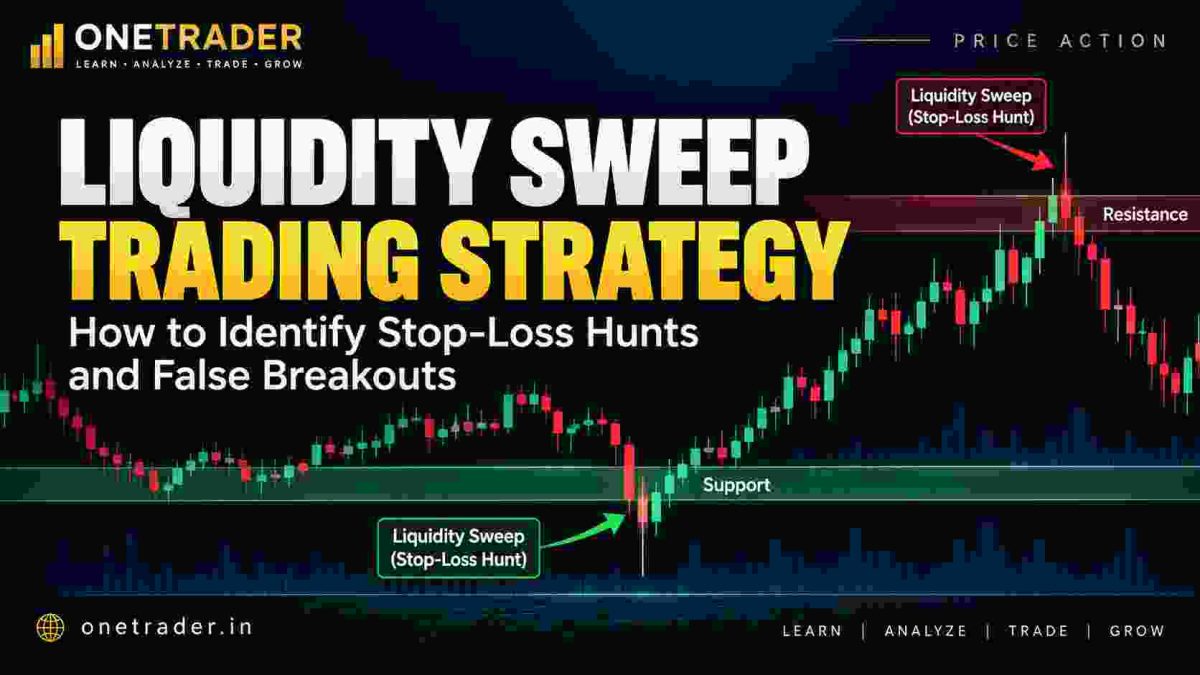
Have you seen a stock break above resistance, attract buyers and then suddenly fall? Or watched price move below support, trigger stop-loss orders and quickly recover? These movements are often described as liquidity sweeps. Understanding them helps traders recognize potential false breakouts rather than entering simply because price crosses a level.
What Is Liquidity in Trading?
Liquidity describes how easily an asset can be bought or sold without substantially changing its price. Price action traders also discuss areas where orders may cluster. Stop-loss orders from buyers may sit below swing lows, while short sellers’ protective buy stops may sit above swing highs. A chart alone cannot reveal the exact number or location of these pending orders.
What Is a Liquidity Sweep?
A liquidity sweep is a move beyond a significant previous high or low followed by a return toward the earlier trading range. Suppose a stock repeatedly struggles at ₹1,000, rises to ₹1,015, then reverses and closes below ₹1,000. Traders may describe this as a buy-side liquidity sweep. The opposite can occur below support.
Buy-Side Liquidity Sweep
Previous swing highs, equal highs and resistance zones may attract breakout buy orders and buy stops from short sellers. If price crosses the area and quickly falls back, the breakout may have failed. However, breaking a high does not automatically predict a reversal: strong trends can continue higher.
Also Read: Candlestick Patterns: 7 Powerful Patterns Every Price Action Trader Should Know
Sell-Side Liquidity Sweep
Previous lows, equal lows and support zones may attract stop-loss sell orders from long positions and breakdown entries. Imagine support near ₹750. Price falls to ₹738 but closes back above ₹750. This can indicate rejection of lower prices, although further buying confirmation remains important.

Liquidity Sweep vs Genuine Breakout
A genuine breakout may show sustained trading beyond the level, strong momentum and continuation. A possible sweep often moves beyond a level temporarily and returns inside the range. A candle closing below resistance after briefly crossing it suggests rejection; consecutive strong closes above it support a breakout interpretation. Neither signal guarantees the next move.
How to Identify Liquidity Sweeps
Start with meaningful swing highs and lows on daily or weekly charts. Look for equal highs, equal lows and established ranges. When price crosses one of these areas, examine whether it holds outside the range or quickly returns. Rejection wicks, candle closes and follow-through can help assess the reaction. Lower timeframes can show the detail, but higher-timeframe context matters.
Using Market Structure for Confirmation
After price sweeps above resistance and falls back, a break below a recent minor swing low can suggest weakening upward momentum. After a sweep below support, a move above a minor swing high may indicate recovering demand. These are additional clues, not certain reversal signals.
Also Read: Breakout Trading Strategy: How to Identify Real & False Breakouts
Risk Management
Entering immediately after a rejection wick can be risky: price may test the extreme again or resume its original trend. Define the point that invalidates the setup and consider volatility when placing a stop-loss. Adjust position size to the distance to the stop and the amount of capital at risk. Check that nearby price levels leave adequate potential reward.
Common Mistakes
Do not assume every false breakout is a deliberate institutional stop-loss hunt. Price can reverse because of shifting supply and demand, news or ordinary volatility. Avoid trading every sweep in isolation: a temporary break below support in a strong downtrend may precede more selling.
Conclusion
Liquidity sweeps illustrate why a brief move beyond a high or low does not always establish a lasting breakout. Focus on important levels, closing prices, rejection and subsequent market structure. The key lesson: do not trade a breakout merely because price crossed a level; study what happens afterward.
Disclaimer
The content published on Onetrader is for educational and informational purposes only. It is not investment advice or a recommendation to buy or sell securities. Onetrader is not a SEBI-registered investment adviser or research analyst. Trading and investing involve market risks. Conduct independent research or consult a qualified financial professional before making decisions.
Also Read: Volume Profile Trading Strategy for Better Trading


Keep learning with OneTrader
Explore structured lessons and practical guides to build your market knowledge.