Estimated reading time: 3 minutes
Thank you for reading this post, Please bookmark onetrader.in website for regular updates!
🧠 What is Support & Resistance? Explained With Charts
By Onetrader Guide
📈 Introduction
Every trader hears the words support and resistance almost every day — but very few truly understand how powerful they are. These two levels often decide where the market will bounce and where it will reverse.
Let’s break it down in simple terms with examples and charts so you’ll never confuse them again.
🧩 What is Support?
Support is a price level where the stock (or index) tends to stop falling and start rising.
It acts like a floor for the price.
When the price comes down to this level, buyers enter the market, pushing it back up.
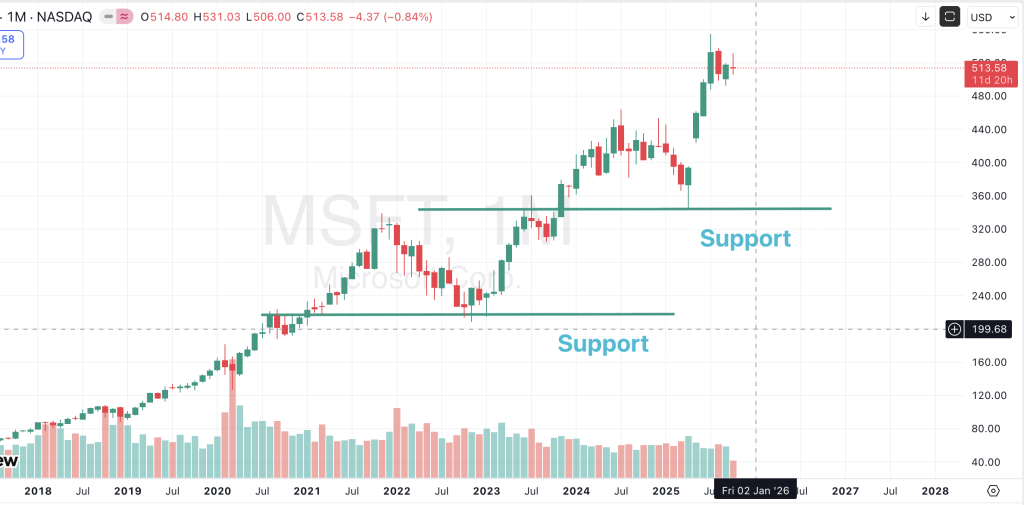
📊 Example:
Imagine a stock repeatedly bouncing near ₹200.
Every time it touches ₹200, buyers step in.
So ₹200 becomes a support level.
🧱 What is Resistance?
Resistance is the opposite of support — it acts as a ceiling for the price.
It’s a level where the stock usually stops rising and starts falling because sellers become active.
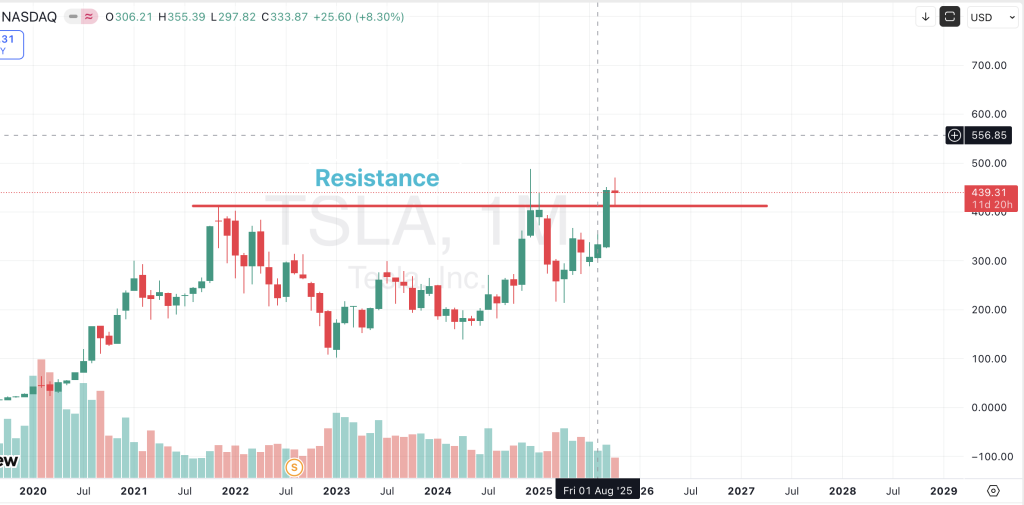
📊 Example:
If a stock struggles to move above ₹300 multiple times, ₹300 is the resistance level.
🔄 How to Identify Support & Resistance on Charts
- Look for swing highs and swing lows.
- A previous low that caused a bounce = Support
- A previous high that caused a fall = Resistance
- Use line or candle charts
- Connect the price points with horizontal lines.
- You’ll start seeing zones where price reacts repeatedly.
- Remember:
- Support and resistance are not exact prices, but zones or areas.
⚙️ How They Work in Real Market
Let’s take an example of Nifty 50.
Suppose Nifty has touched 22,000 several times and bounced — that’s your support zone.
If it has struggled near 22,800, that’s your resistance zone.
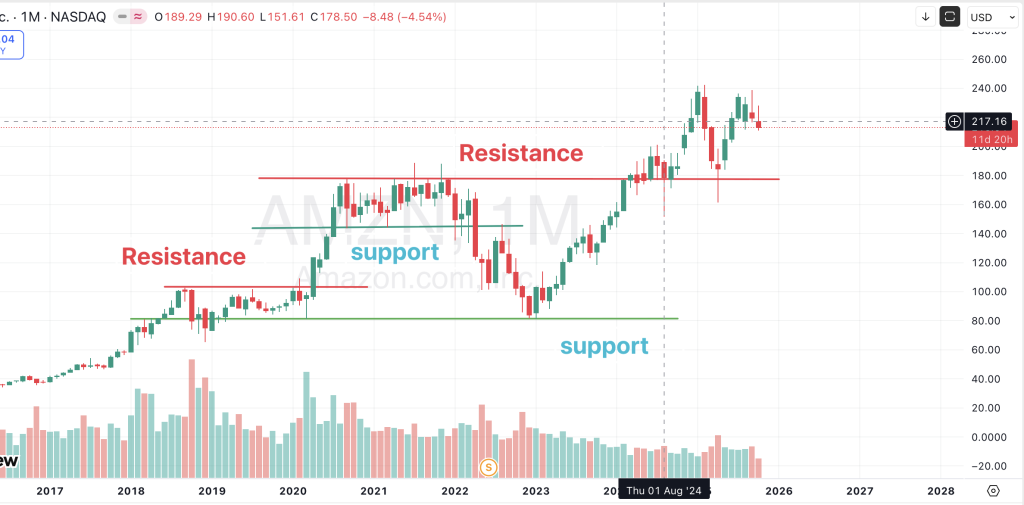
Now, if the price breaks above resistance, that resistance often becomes new support.
Similarly, when support breaks, it often turns into resistance.
This is called Role Reversal.
📚 Real-Life Analogy
Think of it like a tennis ball in a room:
- The floor is support (the ball bounces back up).
- The ceiling is resistance (the ball hits it and falls).
- If the ball breaks the ceiling, the upper floor becomes the new ground — the new support.
💡 Bonus Tip: Volume Confirms Strength
Whenever price touches support or resistance:
- High volume + bounce → Strong confirmation.
- Low volume + fake move → Be cautious, possible trap.
⚔️ Common Mistakes Traders Make
- Treating it as an exact price.
→ Always use zones. - Ignoring volume confirmation.
- Entering late after breakout without retest.
→ Always wait for confirmation.
🧠 Pro Insight – Institutional Behavior
Big players (institutions) build positions around support and resistance zones.
They often trigger fake breakouts to trap retail traders — called stop-hunting.
So, never assume — always confirm with price action and volume.
📊 Example Chart Breakdown
(Add chart with multiple bounces near ₹200 as support and multiple rejections near ₹300 as resistance. Then show breakout and retest.)
🏁 Conclusion
Support and Resistance are the foundation of trading — whether you use price action, indicators, or algo systems, everything revolves around these two key levels.
Next time you open a chart, ask yourself:
“Where are the buyers likely to step in?”
“Where will the sellers become active?”
Answer these two questions — and you’ll start seeing the market more clearly than most traders.
🌐 By Onetrader Guide
Stay tuned for the next article in our Trading Concepts series:
“Breakouts: How to Identify Real vs Fake Moves.”