
Part of the OneTrader ecosystem OurPaisa All Tools
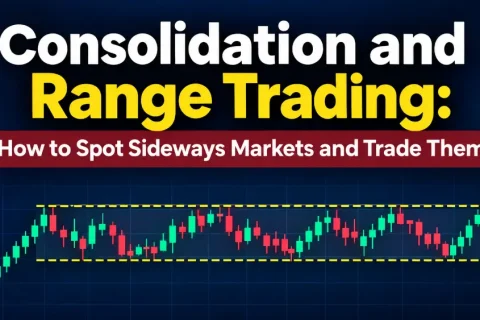
Consolidation and range trading showing sideways stock price movement between support and resistance with a breakout.
Price Action

Consolidation and Range Trading: How to Spot Sideways Markets and Trade Them

Learn how to identify sideways markets, draw support and resistance zones, use technical indicators and trade consolidation ranges with proper risk management.
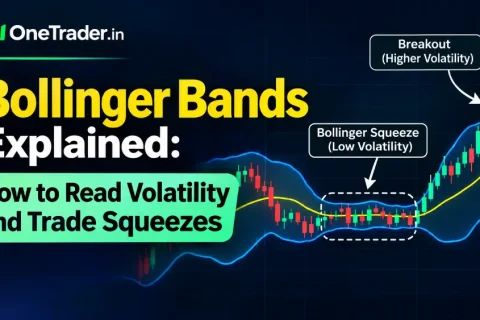
Bollinger Bands technical analysis chart showing volatility squeeze, narrowing bands and bullish breakout.
Technical Analysis

Bollinger Bands Explained: How to Read Volatility and Trade Squeezes

Learn how Bollinger Bands work, understand volatility contraction and expansion, identify Bollinger Band squeezes, and trade potential breakouts using price action and volume confirmation.