
Part of the OneTrader ecosystem OurPaisa All Tools
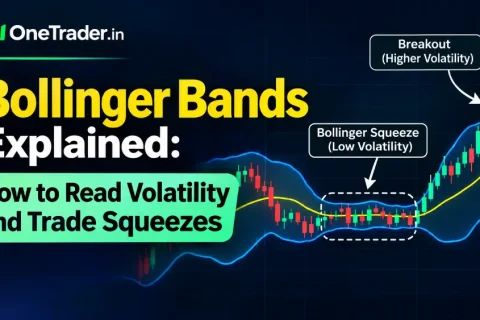
Bollinger Bands technical analysis chart showing volatility squeeze, narrowing bands and bullish breakout.
Technical Analysis

Bollinger Bands Explained: How to Read Volatility and Trade Squeezes

Learn how Bollinger Bands work, understand volatility contraction and expansion, identify Bollinger Band squeezes, and trade potential breakouts using price action and volume confirmation.
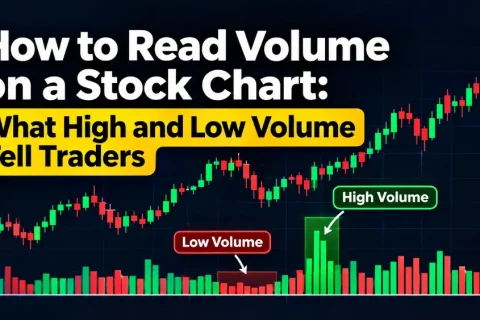
How to read volume on a stock chart showing high and low volume bars alongside candlestick price movements.
Chart Reading

How to Read Volume on a Stock Chart: What High and Low Volume Tell Traders

Learn how to read volume on a stock chart, understand high and low volume, identify breakout strength and use volume with price action for better trading decisions.