
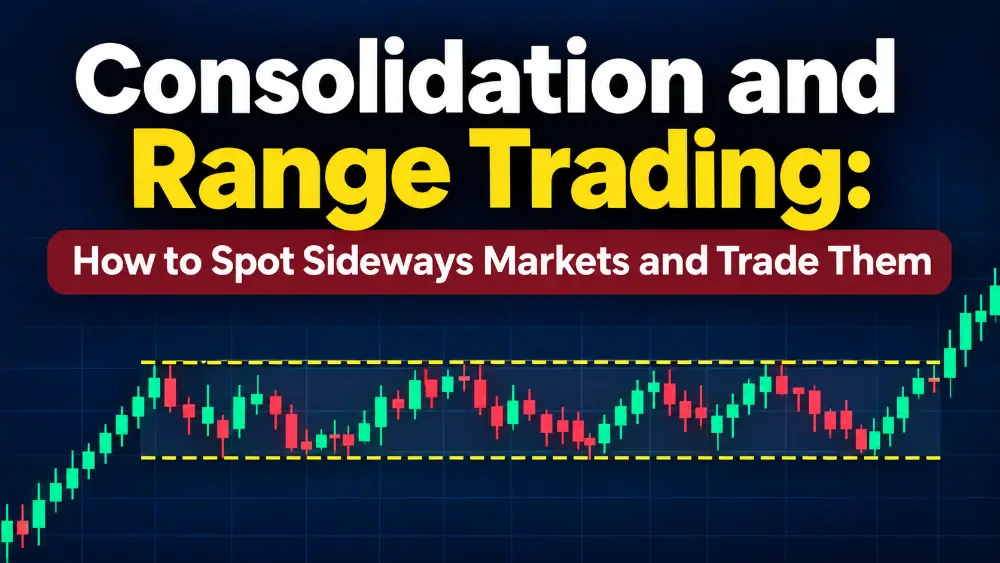
Financial markets do not always move in clear upward or downward trends. There are periods when stock prices move within a relatively narrow band, repeatedly testing the same support and resistance levels without establishing a decisive direction. This phase is known as consolidation, and it can offer trading opportunities for investors who understand how to identify and trade sideways markets.
Range trading focuses on buying near established support and selling near resistance while managing the risk of a potential breakout. However, not every sideways-looking chart offers a reliable trading opportunity. Recognising genuine consolidation, identifying important price boundaries and waiting for confirmation are essential.
In simple words: Consolidation happens when buyers and sellers are temporarily balanced, keeping prices within a defined range. Range traders look to buy near the lower boundary and sell near the upper boundary, while remaining alert to breakouts that can invalidate the setup.
What Is Consolidation in the Stock Market?
Consolidation is a market condition in which an asset trades within a relatively defined price range instead of forming a sustained upward or downward trend. Buyers provide support near the lower end, while sellers create resistance near the upper end.
Also Read: Opening Range Breakout Strategy: Rules, Entry, Stop-Loss and Common Mistakes
For example, if a stock repeatedly moves between ₹480 and ₹520 without sustaining a move beyond either level, it may be consolidating.
Consolidation can last for a few trading sessions, several weeks or even months. It often occurs after a strong price movement, as the market pauses before deciding its next direction.
How to Identify a Sideways Market
A sideways market can be identified through a combination of price action, support and resistance, moving averages and volume.
| Indicator | What to look for |
|---|---|
| Price action | Repeated movement between similar highs and lows |
| Support | Multiple price rejections near the lower boundary |
| Resistance | Repeated selling near the upper boundary |
| Moving averages | Flattening or frequently overlapping averages |
| Volume | Often declines during consolidation |
| ADX | A reading below 20 can indicate a weak trend |
These indicators provide context rather than guaranteed signals. Price structure should remain the primary consideration.
Also Read: Market Structure Explained: HH, HL, LH and LL
Understanding Support and Resistance in a Trading Range
Support and resistance define the boundaries of a consolidation zone. Support is the area where buying interest repeatedly prevents prices from falling further. Resistance is where selling pressure repeatedly limits upward movement.
Traders should treat these levels as zones rather than exact prices. A stock may briefly move beyond a boundary because of intraday volatility before returning to the range.

A stronger trading range generally has multiple clearly visible reactions at both boundaries. Avoid drawing a range around every minor price fluctuation.
How Range Trading Works
Range trading involves taking positions near the boundaries of an established trading range rather than chasing prices in the middle.
Also Read: Sector-Wise ETF Swing Trading Strategy: 5% Target, 5% Stop Loss and Bulk Buying Plan
| Trading zone | Possible strategy |
|---|---|
| Near support | Look for bullish rejection and buying confirmation |
| Middle of range | Avoid fresh entries due to limited reward potential |
| Near resistance | Look for bearish rejection and selling confirmation |
| Beyond resistance | Watch for a confirmed bullish breakout |
| Below support | Watch for a confirmed bearish breakdown |
For example, consider a stock trading between ₹480 and ₹520.
A trader may look for a buying opportunity around ₹482 to ₹488 after bullish confirmation. The potential target could be near ₹515 to ₹520, with a stop-loss below the support zone.
The actual entry, stop-loss and target should depend on volatility, risk tolerance and the quality of the setup.
Technical Indicators Used in Range Trading
Relative Strength Index (RSI): RSI can help identify momentum shifts near range boundaries. Readings below 30 near support or above 70 near resistance may provide additional context, but these levels should not be treated as automatic entry signals.
Also Read: Pullback Trading Strategy: How to Trade Trend Retracements Using Price Action
Bollinger Bands: During consolidation, Bollinger Bands often contract as volatility decreases. Price movement near the upper or lower band can help traders observe potential reversals.
Average Directional Index (ADX): ADX measures trend strength rather than direction. Lower readings, particularly below 20, can indicate a market without a strong established trend.
Volume: Declining volume during consolidation can suggest reduced participation. A significant increase in volume during a breakout can strengthen the case for a genuine directional move.
Consolidation vs Breakout: Understanding the Difference
A consolidation phase can eventually produce a breakout or breakdown. Traders need to distinguish between a temporary move outside the range and a genuine change in market direction.
Also Read: Strategy #2: Trend Line Trading Strategy – How to Identify Trends, Entries and Breakouts
| Feature | Consolidation | Breakout |
|---|---|---|
| Price movement | Within established boundaries | Moves beyond boundaries |
| Trend strength | Usually weak | Potentially increasing |
| Volume | Often subdued | May expand significantly |
| Trading approach | Buy support, sell resistance | Look for directional opportunities |
A candle closing beyond resistance or support, accompanied by stronger volume and follow-through, offers better confirmation than a brief intraday price spike.
Common Mistakes to Avoid in Range Trading
One common mistake is entering trades in the middle of the range, where neither support nor resistance offers a clear advantage.
Other mistakes include treating every minor price fluctuation as a trading range, placing stop-losses too close to support or resistance, ignoring broader market conditions and assuming that a range will continue indefinitely.
Traders should also avoid repeatedly buying support without confirmation. A level that has held several times can eventually fail when selling pressure increases.
Also Read: Liquidity Sweep Trading Strategy: How to Identify Stop-Loss Hunts and False Breakouts
Risk Management in Sideways Markets
Range trading requires disciplined risk management because false breakouts and sudden breakdowns can occur without warning.
Before entering a trade, identify the invalidation level, calculate the position size and ensure that the potential reward justifies the risk.
A risk-to-reward ratio of 1:2 can be a useful planning benchmark, although not every range provides such an opportunity. If the available reward is too small relative to the stop-loss distance, skipping the trade is often the better decision.
Key Takeaways
- Consolidation occurs when prices move within a defined range without a sustained trend.
- Support and resistance are the most important elements of range identification.
- Range traders generally look for buying opportunities near support and selling opportunities near resistance.
- RSI, Bollinger Bands, ADX and volume can provide additional confirmation.
- Avoid entering trades in the middle of the range without a clear advantage.
- Confirm breakouts through closing prices, volume and follow-through.
- Always define stop-losses and position sizes before entering a trade.
Financial Disclaimer: This article is intended for educational purposes only and should not be considered investment advice or a recommendation to buy or sell any security. Stock market trading involves financial risk, and range trading strategies do not guarantee profits. Investors and traders should conduct their own research, follow appropriate risk management practices and consult a qualified financial adviser when necessary.
Also Read: Candlestick Patterns: 7 Powerful Patterns Every Price Action Trader Should Know


Keep learning with OneTrader
Explore structured lessons and practical guides to build your market knowledge.

Need a laugh after all that money talk?
Paisa LOL: India's funniest finance page, with memes, comics, jokes and long funny stories.