
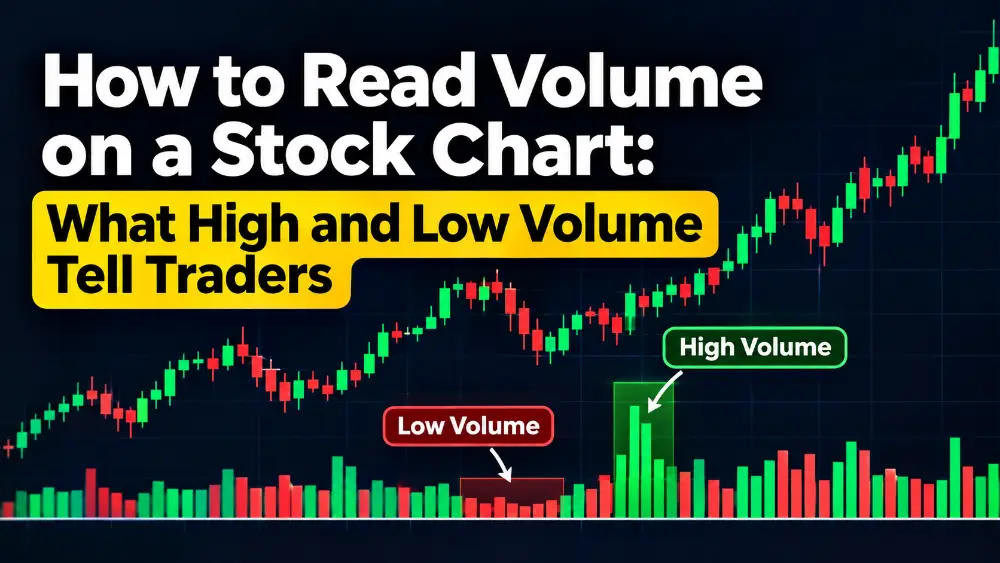
Price tells traders where a stock is moving. Volume helps explain how much participation is behind that movement. A stock can rise sharply on strong buying activity or move higher with relatively little participation. These situations may look similar on a candlestick chart, but they can carry very different implications.
Volume is one of the most useful tools in technical analysis because it helps traders assess buying interest, selling pressure, breakouts, reversals and the strength of an existing trend. Understanding how to interpret volume alongside price action can help traders avoid weak trading signals and make better-informed decisions.
In simple words
Volume shows how many shares are traded during a particular period. High volume indicates greater trading activity, while low volume indicates relatively limited participation. When combined with price movement, volume helps traders judge the strength or weakness of a market move.
Also Read: Candlestick Patterns: 7 Powerful Patterns Every Price Action Trader Should Know
What Is Volume in a Stock Chart?
Volume represents the total number of shares traded during a specific period. For example, if a stock records a volume of 5 lakh shares on a daily chart, it means 5 lakh shares changed hands during that trading session.
Most trading platforms display volume as vertical bars below the price chart. Each bar corresponds to the trading activity during that candle.
- Green volume bars generally indicate that the closing price was higher than the opening price.
- Red volume bars generally indicate that the closing price was lower than the opening price.
The colour convention can vary between charting platforms. Volume itself measures traded shares, not whether every trade was a buy or sell.
What Does High Volume Tell Traders?
High volume indicates strong participation from market participants. It often appears when institutional investors, traders and other market participants actively trade a stock.
Also Read: Chart Reading Concepts – Complete Roadmap (by Onetrader)
However, high volume does not automatically mean bullish momentum. Its interpretation depends on price direction and the location of the stock on the chart.
| Price movement | What high volume may indicate |
|---|---|
| Price rises | Strong buying interest |
| Price falls | Strong selling pressure |
| Price breaks resistance | Possible breakout confirmation |
| Price breaks support | Possible bearish breakdown |
| Price moves sideways | Heavy buying and selling activity |
For example, if a stock breaks above ₹500 resistance with significantly higher volume, the breakout may have stronger participation behind it than a breakout occurring on weak volume.
What Does Low Volume Tell Traders?
Low volume indicates limited participation compared with the stock’s usual trading activity.
When a stock rises on low volume, traders may question whether enough buying interest exists to sustain the upward movement. Similarly, a decline on low volume may indicate relatively weak selling participation.
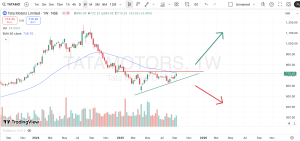
Also Read: Tata Motors Chart Reading

| Price movement | Possible interpretation |
|---|---|
| Price rises | Weak buying participation |
| Price falls | Limited selling pressure |
| Breakout on low volume | Breakout may lack confirmation |
| Pullback on low volume | Selling pressure may be weakening |
| Sideways movement | Reduced market participation |
Low volume is not necessarily bearish. For example, during an uptrend, a stock pulling back towards support on declining volume can indicate that selling pressure is reducing.
How to Identify a Strong Breakout Using Volume
Volume is particularly useful when trading support and resistance breakouts.
Suppose a stock has repeatedly faced resistance around ₹1,000. It eventually moves above this level with a strong bullish candle and volume significantly above its recent average.
This combination suggests stronger participation in the breakout.
Also Read: 📊 Chart Analysis Procedure (Step-by-Step Guide)
A practical comparison:
| Breakout condition | Interpretation |
|---|---|
| Large bullish candle + high volume | Stronger breakout signal |
| Large bullish candle + low volume | Needs caution |
| Small candle + high volume | Possible buying and selling battle |
| Breakout followed by falling volume | Momentum may be weakening |
Traders should also watch whether the price sustains above resistance. A candle closing above resistance is generally more meaningful than a temporary intraday move above the level.
How to Use Volume During a Trend
Volume can help traders understand whether an existing trend is attracting participation.
During an uptrend: Rising prices accompanied by increasing volume can indicate strengthening buying interest. If prices continue rising but volume consistently declines, traders should watch for weakening momentum.
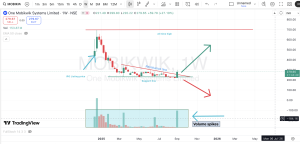
Also Read: Mobikwik Chart analysis
During a downtrend: Falling prices with increasing volume may indicate stronger selling pressure. A decline accompanied by decreasing volume may suggest that selling participation is reducing.
During a pullback: In a healthy uptrend, a pullback on relatively low volume followed by a bullish recovery on higher volume can provide a useful confirmation signal.
What Is Average Volume and Why Does It Matter?
Looking at one volume bar in isolation can be misleading. Traders should compare current volume with the stock’s recent average volume.
Average volume measures the typical number of shares traded over a selected period.
For example, a 20-day average volume indicator helps traders compare today’s trading activity with the average activity over the previous 20 trading sessions.
| Current volume vs average | Interpretation |
|---|---|
| 0.5x | 50% of average volume |
| 1x | Equal to average volume |
| 1.5x | 50% above average |
| 2x | Double the average volume |
| 3x | Triple the average volume |
These are illustrative comparisons, not fixed trading thresholds. A volume increase should always be interpreted alongside price action and market conditions.
What Is Volume Climax?
A volume climax occurs when trading activity rises exceptionally high, often during a sharp price movement.
It can appear near the end of a strong rally or a prolonged decline.
For example, a stock that has been falling for several sessions may suddenly experience extremely high volume and a long lower wick. This could indicate aggressive buying interest entering the market.
However, a volume climax does not confirm an immediate reversal. Traders should wait for subsequent price action to establish whether buyers or sellers have gained control.
Common Volume Trading Mistakes
Traders often misinterpret volume by looking at individual bars without considering the broader chart structure.
Some common mistakes include:
- Assuming every high-volume candle is bullish.
- Treating low-volume breakouts as confirmed trading opportunities.
- Ignoring nearby support and resistance levels.
- Comparing volume across stocks with very different liquidity.
- Entering trades based only on a sudden volume spike.
- Ignoring the closing price and candle structure.
Volume should support a trading decision, not replace price action analysis.
How Traders Can Combine Volume with Price Action
A practical approach is to analyse volume together with candlestick patterns, support and resistance, and trend direction.
Consider a stock approaching a resistance zone. If it forms a bullish engulfing candle near that level and subsequently breaks resistance with higher-than-average volume, the combination provides stronger evidence of buying interest.
Similarly, if a stock approaches support and forms a bullish rejection candle with increasing volume, traders can watch for confirmation from the next candle.
The important point is to understand where volume appears, how price reacts and whether the movement is sustained.
Key Takeaways
- Volume measures the total number of shares traded during a particular period.
- High volume indicates increased market participation, not necessarily buying.
- Low volume indicates reduced trading activity and can signal weaker participation.
- Breakouts supported by higher-than-average volume generally carry stronger confirmation.
- Declining volume during an uptrend pullback can indicate reducing selling pressure.
- Average volume provides a useful benchmark for interpreting unusual activity.
- Volume should always be analysed alongside price action, trend direction and support and resistance.
Financial Disclaimer
This article is intended for educational purposes only and should not be considered investment or trading advice. Stock market investments and trading involve financial risks. Readers should conduct their own research and consult a qualified financial advisor before making investment decisions.


Keep learning with OneTrader
Explore structured lessons and practical guides to build your market knowledge.

Need a laugh after all that money talk?
Paisa LOL: India's funniest finance page, with memes, comics, jokes and long funny stories.