

Mobikwik Chart analysis.
Step 1: Trend analysis
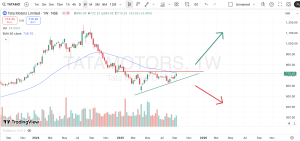
1st chart ni weekly time frame lo chuste will get know the trend of the chart,so currently mobikwik in reversal zone
Step 2: Pattern
Next manam chustuna pattern Descending Triangle pattern so we need to check that price is breakout or not

Step 3: Entry
So Manam breakout aina tarvatha matrame entry plan chesukovali leda wait for that
Also Read: Candlestick Patterns: 7 Powerful Patterns Every Price Action Trader Should Know
Step 4: Volume
Breakout time lo volume ela undi kuda observe cheyandi
So Nen chart lo breakout candle, volume and all time high mention chesanu
“This article is for educational purposes only. Not financial advice. Please consult a SEBI-registered advisor before investing.”
Also Read: Chart Reading Concepts – Complete Roadmap (by Onetrader)



Keep learning with OneTrader
Explore structured lessons and practical guides to build your market knowledge.

Need a laugh after all that money talk?
Paisa LOL: India's funniest finance page, with memes, comics, jokes and long funny stories.