
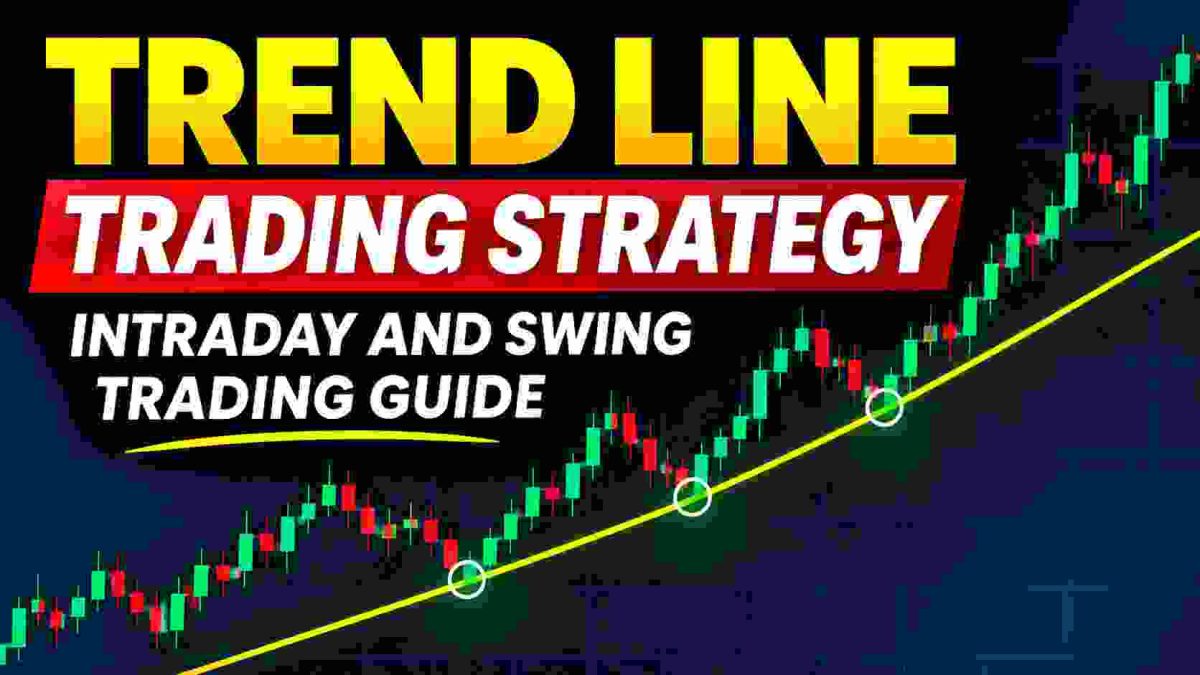
Trend line trading is one of the simplest ways to understand market direction without depending on multiple technical indicators. Whether a trader follows Nifty 50, Bank Nifty or individual stocks, trend lines help identify the direction of price movement, potential entry areas and early signs of weakening momentum. However, drawing a line connecting two price points is not enough to create a reliable trading strategy. The real skill lies in understanding which swing points matter, how price reacts around the trend line and when a trend may be losing strength.
Unlike horizontal support and resistance, which identify important price areas, trend lines follow the direction of the market. They are particularly useful for traders looking to participate in an existing trend rather than attempting to predict every market reversal.
What Is a Trend Line in Trading?
A trend line is a diagonal line drawn on a price chart by connecting important swing highs or swing lows. In an uptrend, traders generally connect rising swing lows to identify an area where buying interest may emerge during pullbacks. In a downtrend, they connect falling swing highs to identify areas where selling pressure may appear during temporary recoveries.
For example, imagine a stock rises from ₹500 to ₹550, corrects to ₹520, advances to ₹580 and then pulls back toward ₹545. Connecting the rising lows around ₹500, ₹520 and ₹545 can reveal an ascending trend line. This suggests buyers have been willing to enter at progressively higher prices, although it does not guarantee that the pattern will continue.
Also Read: Pullback Trading Strategy: How to Trade Trend Retracements Using Price Action
How to Draw Trend Lines Correctly
The first step is identifying meaningful swing points rather than connecting random candles. An ascending trend line should follow the important higher lows of an established uptrend, while a descending trend line should follow the lower highs of a downtrend. Two distinct swing points are sufficient to draw an initial line, but a subsequent reaction can provide additional evidence that the market is responding to that area.
Traders often debate whether trend lines should connect candle bodies or wicks. Neither approach is universally correct. Wicks reveal the full trading range, while candle bodies emphasize opening and closing prices. The important principle is consistency. A trader should avoid repeatedly adjusting a trend line simply to make historical price movements appear perfect. Like support and resistance, diagonal trend lines are better treated as approximate areas rather than exact barriers.
Trend Line Trading Strategy for Intraday Traders
Intraday traders can begin with a 15-minute chart to identify the prevailing direction and then use a five-minute chart to study potential entries. Suppose Nifty forms a series of higher lows during the morning session, creating a visible ascending trend line. Instead of buying after several large bullish candles, a trader can wait for price to pull back toward the line and observe whether buying interest returns.
A potential bullish setup develops when price approaches the trend line, rejects lower prices and subsequently moves above a nearby short-term swing high. The stop-loss can be positioned below the relevant swing low, while the target may be based on the previous session high, intraday resistance or another meaningful price level. If price breaks the trend line without showing a recovery, the trader should reassess the setup rather than assuming the line must hold.

Also Read: Liquidity Sweep Trading Strategy: How to Identify Stop-Loss Hunts and False Breakouts
Trend Line Trading Strategy for Swing Traders
Swing traders generally benefit from studying daily and weekly charts because these timeframes reveal broader trends and reduce some of the noise associated with intraday price movements. Consider a stock that advances from ₹800 to ₹950 over several weeks while forming progressively higher lows. A rising trend line connecting those lows can help identify potential pullback areas.
When the stock returns toward the trend line, the trader should examine whether the correction is slowing and whether bullish price structure is reappearing. A strong recovery candle followed by a move above a recent swing high may provide an entry trigger. The stop-loss should reflect the underlying daily structure, while the potential target can be evaluated against previous highs and resistance zones. Swing trades also require consideration of overnight gaps, which can cause execution beyond the intended stop-loss.
Trend Line Breakout and Retest Strategy
A trend line breakout occurs when price moves beyond an established diagonal boundary. For example, a stock in a downtrend may repeatedly fail near a descending trend line before eventually closing above it. This development suggests that the previous pattern of selling into recoveries may be weakening.
However, a trend line break alone does not confirm a complete trend reversal. Traders can look for additional evidence, such as a higher low, a break above a previous swing high or a successful retest of the broken line. A retest occurs when price returns toward the breakout area and then attempts to continue in the breakout direction. Not every breakout produces a retest, and not every retest succeeds.
Also Read: Breakout Trading Strategy: How to Identify Real & False Breakouts
How to Identify False Trend Line Breakouts
False breakouts are common because price frequently moves temporarily beyond a trend line before returning to its previous structure. Suppose a stock closes below an ascending trend line, encouraging traders to expect a bearish reversal. If the next few candles recover above the line and buyers reclaim the previous swing area, the initial breakdown may have failed.
This is why traders should examine candle closes, nearby support and resistance, and subsequent market structure rather than reacting immediately to a wick crossing the line. A strong bullish candle after a breakdown can indicate recovery, but confirmation becomes more meaningful when price also breaks the lower-high sequence created during the decline.
Combining Trend Lines With Support and Resistance
Trend lines become more useful when combined with horizontal support and resistance. Imagine a stock approaching an ascending trend line at the same time it reaches a previous breakout zone. The overlap creates an area where traders may pay closer attention to price behaviour because two different forms of technical analysis identify approximately the same location.
Nevertheless, multiple overlapping levels do not guarantee a successful trade. The trader still needs evidence of buying or selling pressure and a clearly defined invalidation point. The distance to the next resistance or support zone should also provide sufficient room for a reasonable risk-to-reward ratio.
Also Read: Volume Profile Trading Strategy for Better Trading
Common Mistakes and Risk Management
One frequent mistake is forcing trend lines onto sideways markets where meaningful higher lows or lower highs are absent. Another is treating every third touch as a guaranteed reversal. Trend lines can fail even after several successful reactions, particularly when market conditions change or strong directional momentum develops.
Traders should also avoid placing stop-losses at arbitrary distances directly on the line. A more logical approach is to identify the swing point or price structure that would invalidate the trading idea. Position size should then be calculated according to that risk. If the potential target is too close to justify the stop-loss distance, avoiding the trade may be preferable to forcing an entry.
Final Takeaway
Trend line trading is most effective when used to understand market structure rather than predict exact turning points. An ascending trend line highlights rising swing lows, while a descending trend line helps visualize falling swing highs. Pullbacks, breakouts and retests can create trading opportunities, but each requires confirmation and appropriate risk management.
For both intraday and swing traders, the objective should remain the same: identify a meaningful trend, wait for price to reach an important area, observe the reaction and enter only when the potential reward justifies the risk. A well-drawn trend line provides useful context, but disciplined execution determines how effectively that information is used.
Disclaimer: This article is for educational and informational purposes only and does not constitute investment advice or a recommendation to buy or sell any security. Trading involves financial risk, and no technical strategy guarantees profits. Onetrader is not registered with SEBI as an investment adviser or research analyst.




Keep learning with OneTrader
Explore structured lessons and practical guides to build your market knowledge.

Need a laugh after all that money talk?
Paisa LOL: India's funniest finance page, with memes, comics, jokes and long funny stories.