
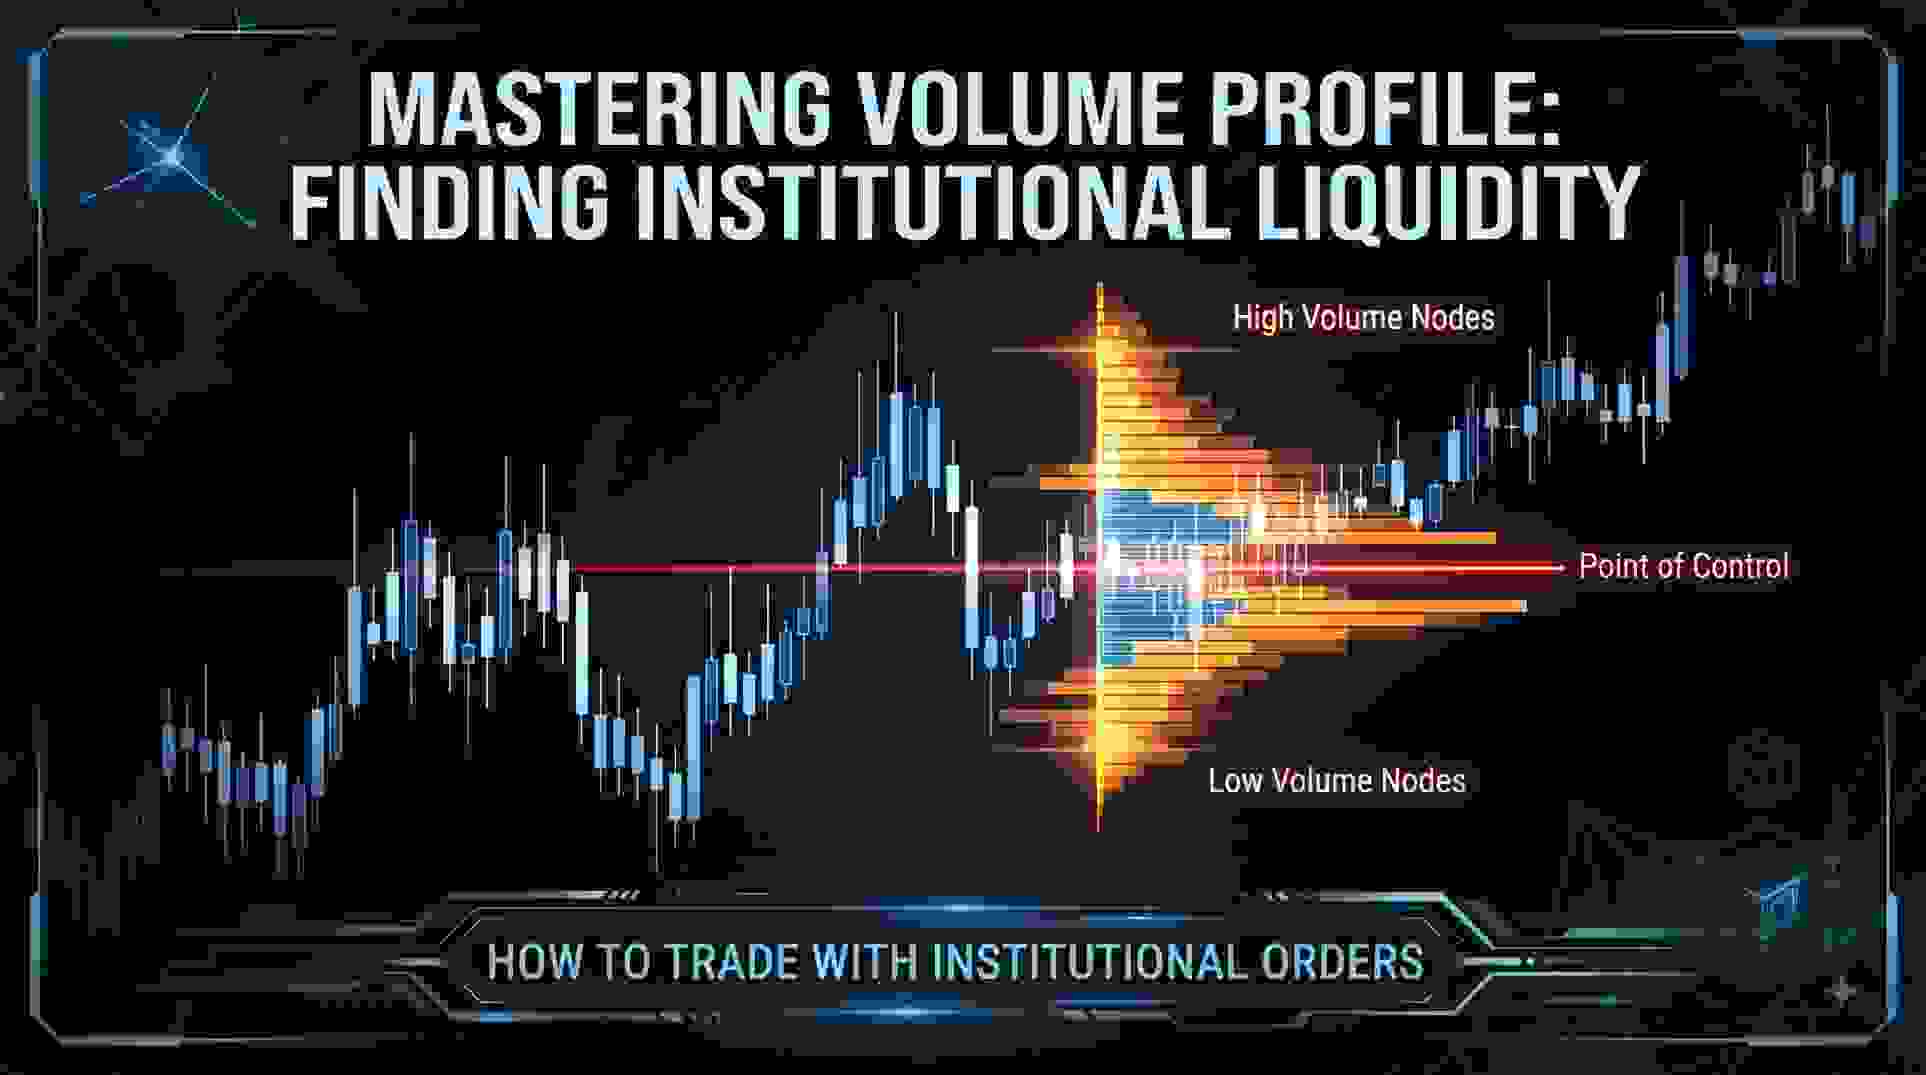
For most retail traders, analyzing price action alone is like looking at a car’s dashboard without knowing how fast the engine is turning. Traditional volume indicators placed at the bottom of a chart show when trading activity happened, but they completely fail to reveal at what price levels that volume actually occurred. This blind spot is precisely why so many traders fall victim to false breakouts and sudden reversals. To trade with the efficiency of modern market participants, incorporating Volume Profile into your daily workflow is no longer optional—it is essential for identifying where real institutional money is changing hands.
Understanding Horizontal Volume Distribution vs. Time-Based Volume
Unlike standard time-based volume charts that stretch vertically beneath your candles, Volume Profile maps trading activity horizontally against price scales. This layout instantly highlights the Price Area of Control, or the exact price level where the highest volume of shares or contracts was traded during a specified period. When institutions accumulate or distribute large positions, they cannot do it in a single high-speed block without crashing or spiking the market. Instead, they build positions slowly, creating heavy volume clusters known as High Volume Nodes. Recognizing these zones gives retail traders a map of strong support and resistance governed by actual liquidity rather than arbitrary moving averages.
Identifying High Volume Nodes and Low Volume Nodes
Conversely, areas characterized by thin trading activity are known as Low Volume Nodes. Price tends to slice through these vacuum zones with remarkable speed because very little resting liquidity or defensive positioning exists there. Understanding this dynamic completely alters how you approach day trading or swing positioning. When a breakout occurs, seasoned traders do not blindly chase the momentum; they look at the volume profile to see if the price is breaking out of a high-volume congestion zone or simply wandering through a low-volume void. Breakouts that initiate from solid volume nodes carry significantly higher statistical reliability.
Utilizing the Value Area for Continuation Trades
Another powerful application of this tool is tracking the Value Area—typically defined as the range where 70% of all market transactions took place. When prices migrate completely outside this value area during a session, it signals a strong imbalance and an aggressive shift in market sentiment. Rather than fighting the trend, smart traders wait for a pullback back toward the point of control or the edge of the value area to execute high-probability continuation trades. By shifting your focus from lagging indicators to structural volume distribution, you stop guessing where the market might turn and start trading right alongside major liquidity pools.
Also Read: RSI Indicator: How to Use RSI for Stock Trading