
Estimated reading time: 2 minutes
Thank you for reading this post, Please bookmark onetrader.in website for regular updates!
Tata Motors Chart Reading | Complete Technical Analysis Guide
Last Updated: 15th Sep,2025:
Tata Motors is one of the most traded stocks in the Indian market. Being part of the Nifty 50 and F&O segment, it attracts huge interest from both traders and long-term investors.
If you are a beginner trying to learn chart reading, Tata Motors is a perfect stock to practice on. In this guide, we’ll break down the step-by-step technical analysis of Tata Motors using charts, support, resistance, and price action.
📊 Understanding Chart Reading Basics:
Before we dive into Tata Motors specifically, let’s understand what chart reading means:
- Candlestick Charts → Each candle shows price movement (green = bullish, red = bearish).
- Timeframes → Intraday traders use 5min/15min charts, while swing traders prefer daily/weekly charts.
- Trend Analysis → Identifying whether the stock is in an uptrend, downtrend, or sideways move.
👉 For beginners, always start with daily charts to understand the bigger picture.
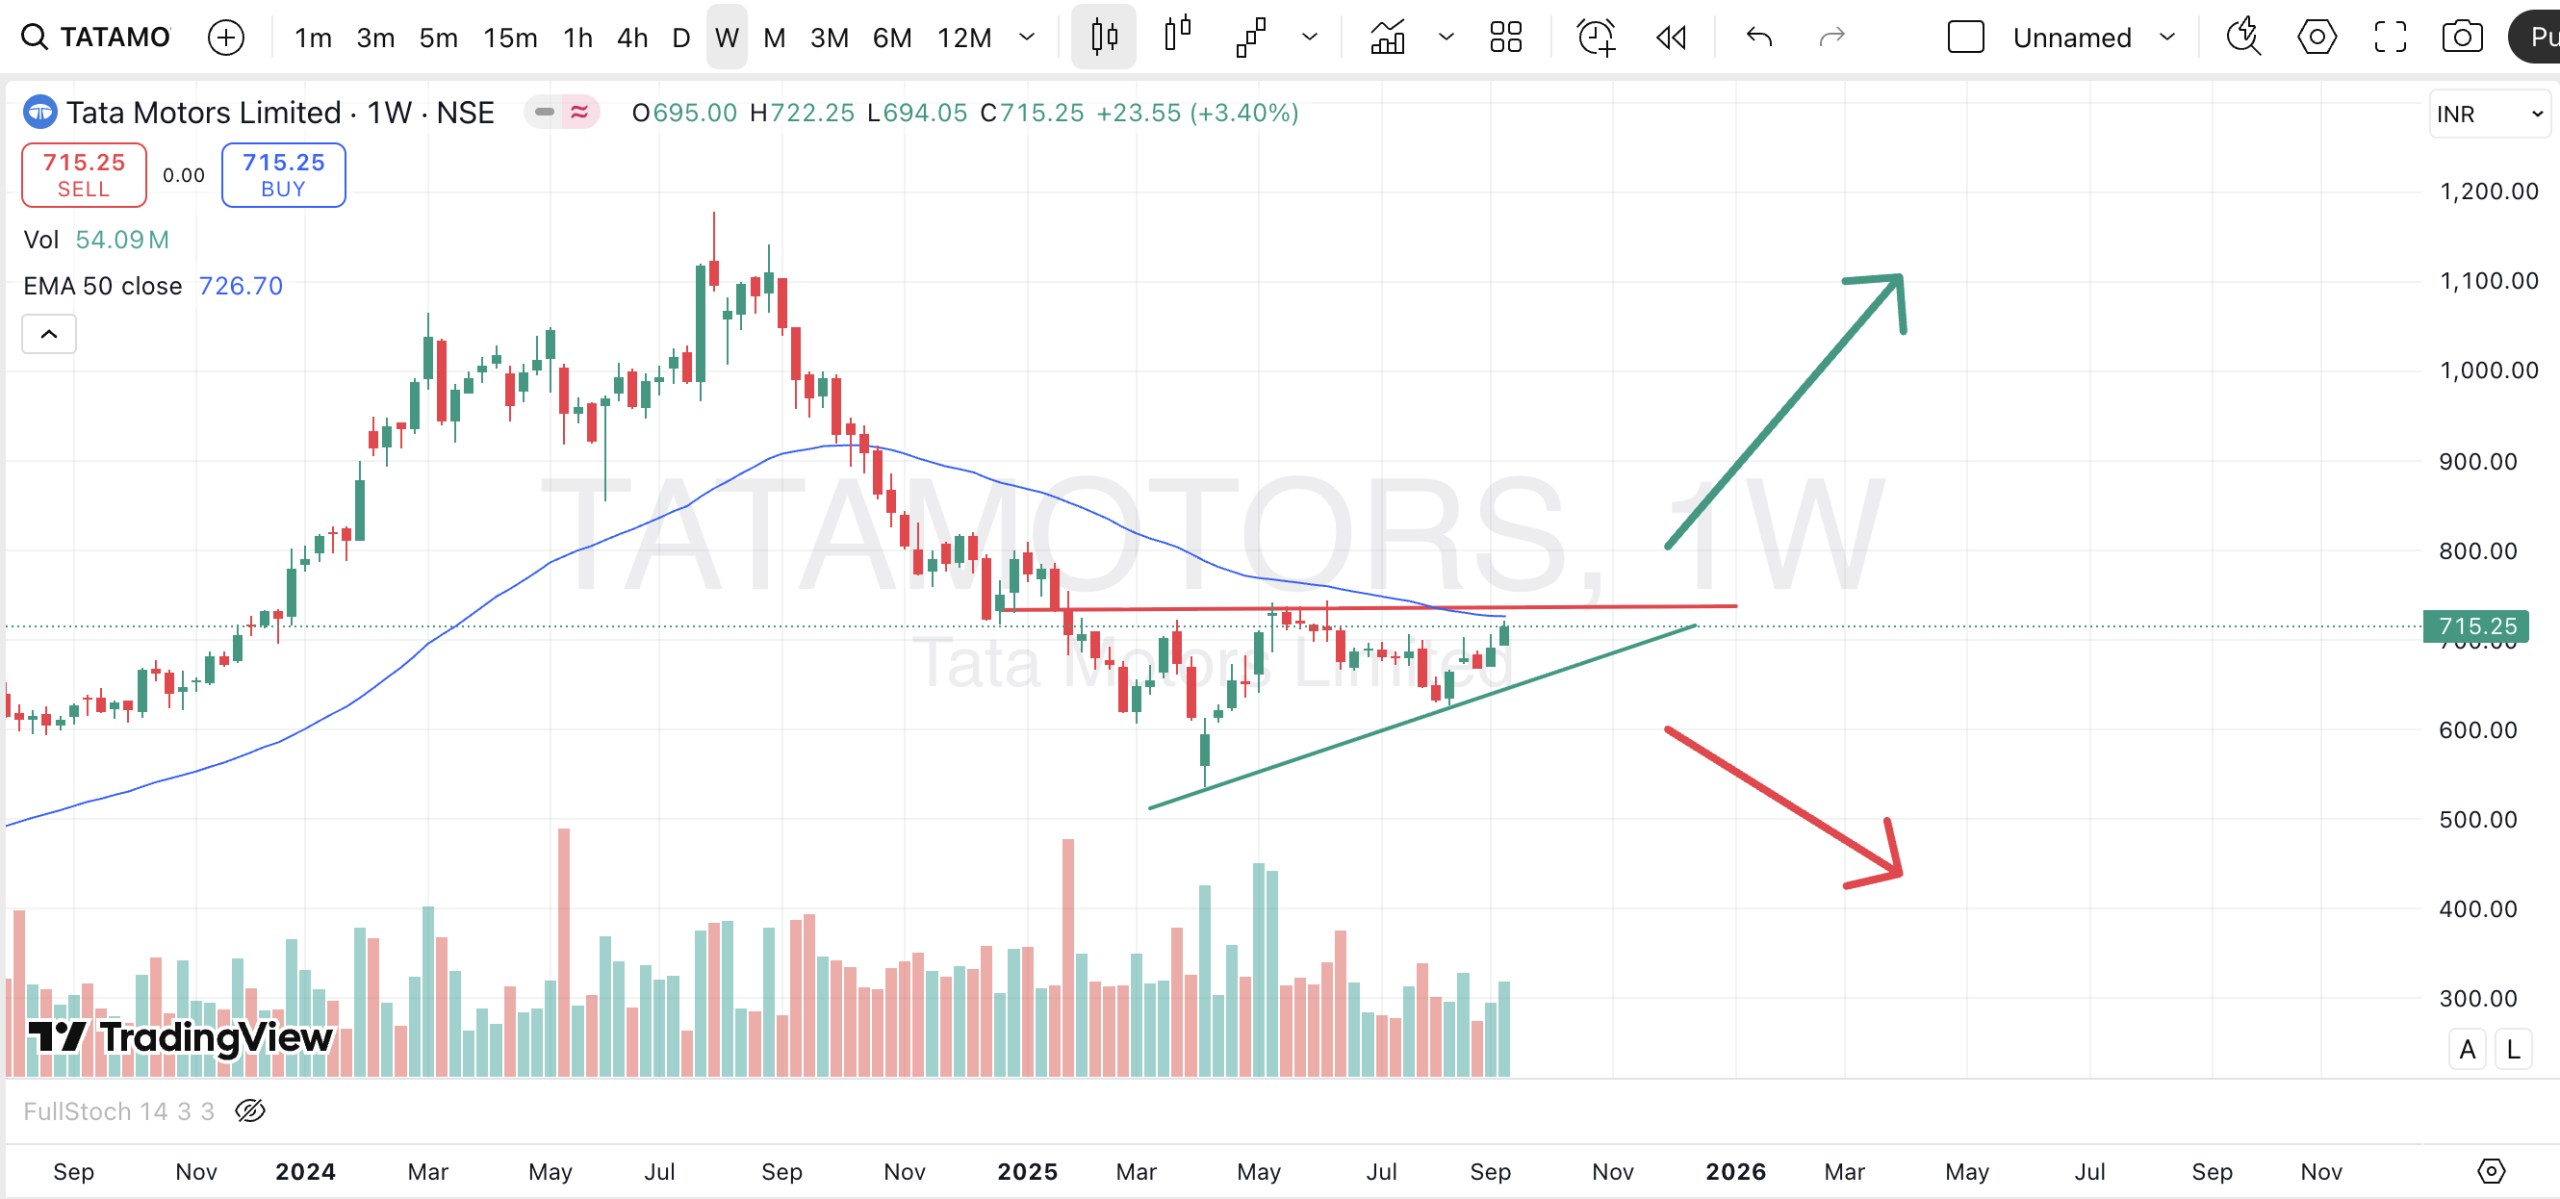
TATAMOTORS Chart analysis:
Step 1: Trend analysis
1st chart ni weekly time frame lo chuste will get know the trend of the chart,so currently Tata Motors at reversal zone
Step 2: Pattern
Let me know what type of pattern formed there comment below
Step 3: Entry
Wait for pattern breakout for long and Breakout down for short
Step 4: Volume
Breakout time lo volume ela undi kuda observe cheyandi
So Nen chart lo breakout candle, volume and all time high mention chesanu