Estimated reading time: 3 minutes
Thank you for reading this post, Please bookmark onetrader.in website for regular updates!
📊 Market is a Reflection of Traders’ Mindset | Candlestick Charts Explained
“Stock market ante okate — manishi psychology reflection.”
What lakhs of traders across the world think and act → adhe market movement lo reflect avutundi.
👉 Example:
- Traders fear lo sell chesthe → prices drop.
- Traders greed tho buy chesthe → prices rally.
So basically, market is nothing but collective emotions of all traders.
🧠 Market Psychology + Price Movement
Markets run on Fear & Greed:
- Fear → panic selling.
- Greed → aggressive buying.
- FOMO → sudden spikes.
- Confidence → long-term trend building.
Ivi anni price lo reflect ayi, candlestick charts lo kanipistayi.
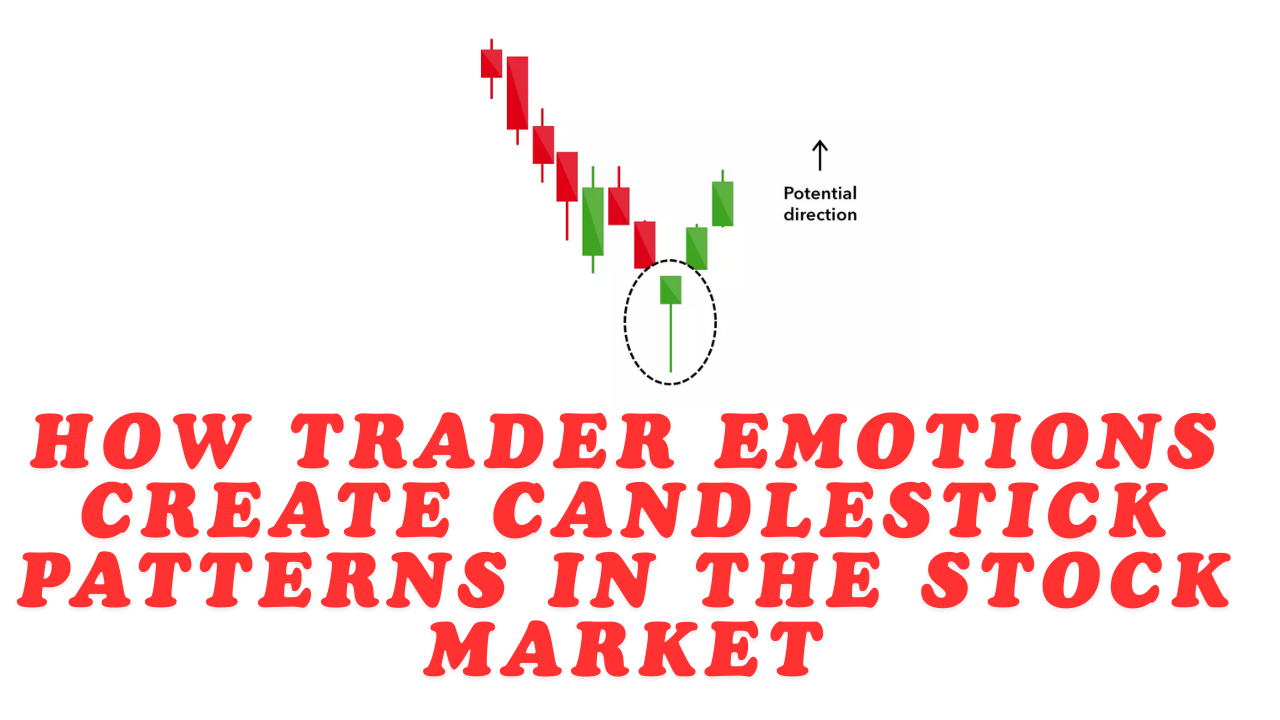
🕯️ Candlestick Charts: Market ki Mirror
Candlestick chart ante visual representation of traders’ emotions.
- Green Candle (Bullish) → Buyers are strong.
- Red Candle (Bearish) → Sellers dominate.
- Doji → Confusion in market.
Candles shape & size → traders mindset ni reveal chestayi.
- Long wick → rejection or fear.
- Strong body → confidence & momentum.
👉 Example:
Oka stock sudden ga high price ki velindi, but wick pedda ga undi → ante traders excitement tho buy chesaru but later fear tho sell kuda chesaru.
🔍 Why Traders Depend on Candlesticks
- Simple visualization – market psychology ni direct ga chupistayi.
- Identify entry & exit points – reversals, breakouts, momentum clear ga kanipistayi.
- Universal language – India, US, Japan… ekkada traders unna candles ardham same.
✅ Final Words
Market = Traders’ emotions.
Candlestick charts = Emotions ki mirror.
So, if you want to succeed as a trader, understand candles as people’s emotions — not just as red and green boxes.
Remember: Chart lo candles ni chusthe, traders mind lo emotions ni chustunnav ani artham.
❓ FAQ Section
Q1. How is the stock market a reflection of trader psychology?
The market moves based on how traders across the world think and act. Fear, greed, and confidence drive buying and selling decisions, which get reflected in price action.
Q2. What do candlestick charts show?
Candlestick charts are the visualization of market momentum. Each candle reflects the collective actions of buyers and sellers within a specific time frame.
Q3. How do emotions appear on candlestick charts?
- Green candle = buying confidence (greed).
- Red candle = selling pressure (fear).
- Doji = confusion/indecision.
- Long wicks = rejection and hesitation.
Q4. Why do traders depend on candlesticks?
Because candles directly show supply, demand, and emotions behind price movement. They help identify entry, exit, and trend reversal points.
Q5. Can candlesticks alone predict market movement?
Candlesticks give strong clues about psychology, but successful trading requires combining them with risk management, support-resistance, and discipline.