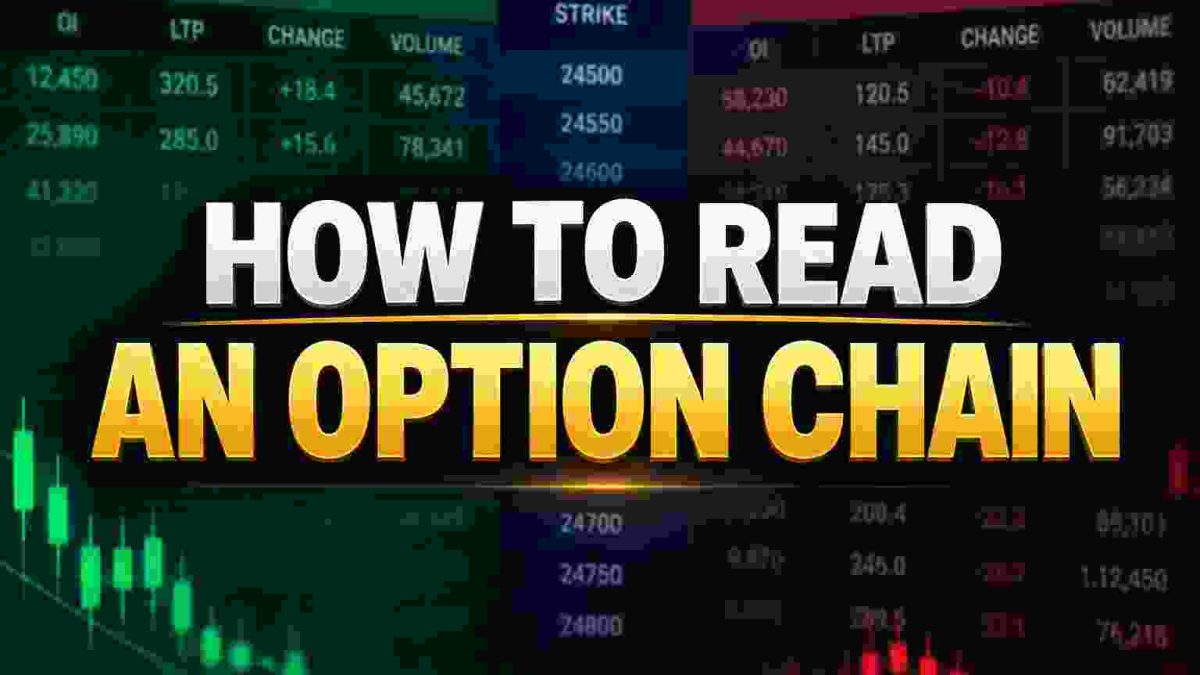
An option chain can look confusing when you see it for the first time. There are multiple strike prices, Call and Put options, premiums, Open Interest, volume, implied volatility and several other numbers displayed together. But once you understand what each section means and how the information fits together, an option chain becomes one of the most useful sources of information for an options trader. An option chain essentially lists the available Call and Put contracts for an underlying asset across different strike prices and expiry dates. NSE provides option-chain data for its equity derivatives market.
What Is an Option Chain?
An option chain is a structured table containing the available options for a particular underlying such as NIFTY, an eligible stock or another derivative underlying. The strike prices generally run through the middle, with Call options displayed on one side and Put options on the other. Each strike represents a different price level at which the option contract is defined. Depending on the platform, the chain can also display information such as Last Traded Price, Open Interest, change in Open Interest, volume, implied volatility and bid-ask prices.
The easiest way for a beginner to understand the structure is to think of the option chain as a map of available option contracts. The strike price is the central reference point, while the Call and Put sides show how the market is pricing different outcomes around those levels. Once you know how to read this map, you can begin to understand where trading activity is concentrated and how option premiums are behaving.
Calls, Puts and Strike Prices
The two primary sections of an option chain are Calls, commonly shown as CE, and Puts, commonly shown as PE. A Call gives its buyer the right to buy the underlying at the specified strike price under the contract terms, while a Put gives its buyer the right to sell it. The strike price is the predetermined price associated with the option contract.
Also Read: How Much Does Life Insurance Cost? Factors That Affect Your Premium
Suppose NIFTY is trading around 25,000 and the option chain shows strikes such as 24,800, 24,900, 25,000, 25,100 and 25,200. The 25,000 strike is close to the current market price and would generally be considered the At-The-Money, or ATM, strike. Strikes on either side can be classified as In-The-Money or Out-of-The-Money depending on whether you are looking at a Call or a Put. Understanding this relationship is essential before trying to interpret Open Interest or option premiums.
What Is Open Interest in an Option Chain?
Open Interest, commonly called OI, represents the number of outstanding option contracts that remain open. It is different from volume. Volume measures how many contracts were traded during a period, whereas Open Interest reflects contracts that remain open after trades have been accounted for. This distinction is important because a strike with high trading volume does not necessarily have the same meaning as a strike with high Open Interest.
Traders often watch large Call OI and Put OI concentrations when analysing an option chain. A large Call OI concentration is commonly interpreted as an area where significant positioning exists and may act as a potential resistance zone, while large Put OI is often watched as a potential support area. However, OI should not be treated as a guaranteed prediction of where the market will stop. Positions can be added, closed or shifted as market conditions change.
What Is Change in Open Interest?
Looking only at total OI is not enough. Change in OI can provide additional information about whether positions are being added or reduced during the trading session. For example, if Call OI increases significantly at a particular strike, traders may examine what is happening to the underlying price, option premium and volume before interpreting that activity.
Also Read: Thinking, Fast and Slow by Daniel Kahneman: Complete Book Summary and Key Lessons
Similarly, a decline in OI can indicate that existing positions are being closed or unwound. This is why experienced traders generally study price, premium, volume and OI together rather than assuming that one number tells the entire story. Option-chain data is more useful when viewed as a combination of signals rather than as a single buy or sell indicator.
What Is LTP in an Option Chain?
LTP stands for Last Traded Price. It represents the most recent price at which that particular option contract was traded. For an options trader, LTP is essentially the current market premium shown for the contract, although the actual executable price can also depend on the bid and ask prices and available liquidity.
Comparing LTP across different strikes can help traders understand how option premiums change as the strike moves farther away from the current underlying price. Options closer to the current price generally have different pricing characteristics from far Out-of-The-Money options. This is one reason simply selecting the cheapest option in the chain can be misleading.
What Is Volume?
Volume tells you how many contracts have been traded during the selected period, usually the current trading session when looking at a live option chain. High volume indicates active trading, but it does not automatically tell you whether traders are bullish or bearish. A contract can have high volume because both buyers and sellers are actively participating.
Also Read: Credit Cards: The Smartest Financial Tool or the Fastest Way Into Debt?
This is why volume should be considered alongside OI. If volume is high but OI does not increase meaningfully, the activity may represent existing positions changing hands rather than substantial new positions being created. Combining volume with price and OI can provide a more useful picture of market participation.
What Is Implied Volatility?
Implied Volatility, or IV, is another important part of the option chain. It represents the market’s expectation of future volatility as reflected in option prices. When expected volatility increases, option premiums can become more expensive, while lower expected volatility can contribute to lower premiums, all else being equal.
This is particularly important because an option buyer can be correct about the direction of the underlying and still receive a disappointing result if other pricing factors move against the position. Therefore, understanding IV becomes increasingly important once a trader moves beyond basic option-chain reading.
How Traders Commonly Identify Support and Resistance
One of the most popular uses of an option chain is identifying areas where significant Call and Put positioning exists. Traders commonly watch strikes with relatively high Put OI as potential support areas and strikes with high Call OI as potential resistance areas. For example, if NIFTY is trading near 25,000 and substantial Put OI is concentrated around 24,800 while substantial Call OI is concentrated around 25,200, traders may watch those levels closely.
Also Read: Demat Account AMC Charges Explained: What Investors Need to Know
However, these levels should be treated as areas of market positioning rather than fixed walls. If the underlying price moves strongly, traders can close or shift positions, causing OI concentrations to change. News, volatility and institutional positioning can also alter the structure of the chain quickly. Therefore, an option chain should complement price analysis rather than replace it.
How to Read an Option Chain Step by Step
A simple approach is to first check the underlying price and identify the nearest ATM strike. Next, select the expiry you are analysing because different expiries can have very different pricing and positioning. Then examine the Call and Put sides around the ATM area, looking at LTP, OI, change in OI, volume and IV. After that, identify important concentrations of OI and observe whether those positions are increasing or decreasing. Finally, compare what the option chain is showing with the actual price action of the underlying.
The key is not to look at one number in isolation. If NIFTY is rising while Call OI is being reduced at a nearby strike, that information may mean something different from a situation where NIFTY is rising while fresh Call OI is being added. Similarly, Put OI changes should be interpreted in the context of price movement rather than automatically labelled bullish or bearish.
Common Mistakes Beginners Make
One of the biggest mistakes beginners make is assuming that the strike with the highest OI will always act as an unbreakable support or resistance level. Another common mistake is confusing volume with Open Interest or assuming that high OI means everyone holding those contracts has the same market view. OI tells you about outstanding positions, but it does not reveal the complete intention of every participant.
Also Read: Biggest Stock Market Crashes in History and Lessons for Investors
Another mistake is buying an option simply because its premium appears cheap. A far Out-of-The-Money option can have a low premium but still carry a low probability of finishing profitably, while time decay and changes in volatility can affect the premium. The option chain provides information, but it does not eliminate the risks associated with options trading.
Final Thoughts
Learning how to read an option chain is an important skill for anyone interested in F&O trading. The chain brings together strike prices, Calls, Puts, premiums, Open Interest, volume and implied volatility in one place, allowing traders to study how options are positioned around the underlying asset.
The most important lesson is to avoid treating the option chain as a prediction machine. High Call OI does not guarantee resistance, high Put OI does not guarantee support, and a change in OI does not provide a standalone trading signal. The real value comes from combining option-chain information with price action, volatility, liquidity and proper risk management.
For beginners, the best approach is to first understand what every column means and then gradually learn how different pieces of data interact. Once the basics become familiar, option-chain analysis can become a useful part of a broader F&O trading framework.
Also Read: Recency Bias in Trading – Why Recent Trends Fool Traders
Financial Disclaimer
This article is provided for educational and informational purposes only and should not be considered investment advice, trading advice or a recommendation to buy or sell any security or derivative contract. Futures and Options involve substantial risk, and losses can be significant. Readers should conduct their own research and consider consulting a qualified financial professional before making investment or trading decisions.