
Introduction
Candlestick patterns are one of the most important foundations of price action trading. Every candle tells a story about the battle between buyers and sellers by showing the open, high, low and closing price for a specific period. But successful trading is not about memorizing dozens of candle names. The real skill is understanding why a candle formed, where it formed, and what it tells us about market behavior.
A candlestick pattern becomes much more meaningful when it appears at an important price level. A bullish rejection candle in the middle of a sideways market may have little significance, while the same pattern near strong support can provide valuable information. This is why candlestick patterns should be combined with market structure, support and resistance, trend and volume rather than treated as automatic buy or sell signals.
1. Bullish Engulfing Pattern
A Bullish Engulfing Pattern occurs when a bearish candle is followed by a larger bullish candle whose body covers the previous candle’s body. It shows that buying pressure has become strong enough to overcome the selling pressure represented by the previous candle.
The pattern becomes more useful when it appears near an important support level or after a decline. Traders should still wait for confirmation instead of assuming that every bullish engulfing candle will produce a reversal.
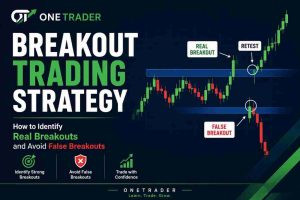
Also Read: Breakout Trading Strategy: How to Identify Real & False Breakouts
2. Bearish Engulfing Pattern
The Bearish Engulfing Pattern is the opposite. A bullish candle is followed by a larger bearish candle that covers the previous candle’s body. This indicates that sellers have taken stronger control during that period.
When it appears near resistance or after an extended upward move, traders may pay closer attention because the market could be showing signs of rejection. However, the surrounding price structure remains more important than the candle name itself.
3. Hammer
A Hammer normally has a relatively small body and a long lower wick. It shows that sellers pushed price lower, but buyers recovered much of the decline before the candle closed.
When a hammer forms near support, it can indicate rejection of lower prices. But a hammer appearing randomly during a range does not automatically represent a strong reversal signal. Location and market context determine its importance.
4. Shooting Star
A Shooting Star generally has a small body and a long upper wick. Buyers push price higher during the session, but sellers eventually reject those higher prices.
A shooting star near resistance can therefore indicate that buyers are struggling to maintain control. Instead of immediately shorting the stock, a price-action trader can wait for confirmation through subsequent price movement or a break of nearby structure.
5. Doji
A Doji forms when the opening and closing prices are very close to each other. It represents a period where buyers and sellers were relatively balanced.
Many beginners assume that a doji automatically means a reversal is coming. That is not correct. A doji can appear frequently during normal market consolidation. Its significance increases when it appears after a strong directional move or near an important support or resistance zone.
6. Inside Bar
An Inside Bar forms when the current candle’s range remains within the previous candle’s high and low. It represents a period of temporary consolidation or compression.
Inside Bars can be particularly interesting when they appear during a strong trend. Traders may watch for price to break out of the pattern in the direction of the broader market move. However, breakouts from Inside Bars can also fail, so confirmation and risk management remain important.
7. Pin Bar
A Pin Bar is characterized by a long wick and a relatively small body. The long wick shows that price moved strongly in one direction but was rejected before the candle closed.
A bullish pin bar with a long lower wick can indicate rejection of lower prices, while a bearish pin bar with a long upper wick can indicate rejection of higher prices. The most useful pin bars generally appear at meaningful price levels rather than randomly on the chart.
Why Context Matters More Than the Candle Pattern
One of the biggest mistakes beginners make is trading candlestick patterns wherever they appear. A trader sees a hammer and immediately buys, or sees a shooting star and immediately sells. This approach ignores the most important part of price action: context.
Before acting on a candlestick pattern, traders should consider where the pattern formed, what the broader trend looks like, whether price is near support or resistance, whether liquidity is nearby and whether there is enough room for a realistic target.
A candle should therefore be viewed as evidence rather than a guarantee. The pattern tells you what happened during that period, while the surrounding market structure helps explain what that information may actually mean.
How to Read Candles Like a Price Action Trader
The candle’s body, wick and closing position can provide valuable information. A strong bullish candle closing near its high can indicate stronger buying pressure, while a bearish candle closing near its low can show stronger selling pressure.
Long wicks can reveal rejection, while large bodies can indicate momentum. Small bodies may show uncertainty or temporary balance. By studying these characteristics together instead of simply memorizing names, traders can begin understanding the behavior behind the candles.
Timeframe also matters. A candlestick pattern on a five-minute chart may be useful for an intraday setup but insignificant compared with a major pattern on a daily or weekly chart. Higher-timeframe structure should therefore provide the broader context, while lower timeframes can help with precise execution.
The Biggest Lesson
Candlestick patterns are not crystal balls. They are visual representations of market behavior. A bullish engulfing candle shows that buyers became stronger during that period. A shooting star shows rejection of higher prices. A doji shows uncertainty. A pin bar shows rejection.
The goal is not to memorize every candle formation. The goal is to understand what price is communicating and then combine that information with market structure, location and risk management.
When traders learn to read candles this way, charts become less complicated. Instead of seeing random green and red candles, they begin to see a continuous story of buying pressure, selling pressure, rejection, momentum and uncertainty.
At Onetrader, the focus is on making technical concepts practical and easy to understand. Candlestick patterns are an important part of that journey because learning to read price begins with understanding what every candle is telling you.
Disclaimer:
The content on Onetrader is for educational/informational purposes only. Not SEBI registered advisors. Trading and investing involve market risks.