Estimated reading time: 6 minutes
Thank you for reading this post, Please bookmark onetrader.in website for regular updates!
Understanding Market Structure – Trends & Ranges (Price Action Series Part 3A)
Introduction
Every successful trader — from Jesse Livermore a century ago to modern-day price action traders — mastered one thing above all else: Market Structure.
Indicators might give you signals, but they don’t reveal the story of the market. That story is hidden in the structure — how price moves, how it breathes, how buyers and sellers fight for control.
👉 If you don’t understand market structure, every candle looks random.
👉 Once you do understand it, every candle makes sense.
In this article, we’ll break down the foundation of technical trading: trends and ranges — and how to use them to find high-probability trades.
1. What is Market Structure?
Market structure is the natural pattern of price movement created by the interaction of buyers and sellers. It shows:
- Who is in control (buyers or sellers)
- Where price is heading
- Where strong reactions may occur
In price action trading, market structure is everything. If you learn how to read it correctly, you can predict what’s likely to happen next — without needing any indicator.
2. Types of Market Structure
Broadly, market structure can be divided into three types:
- Uptrend (Bullish structure) – Buyers are in control.
- Downtrend (Bearish structure) – Sellers are in control.
- Range / Consolidation (Sideways structure) – Neither side is in control.
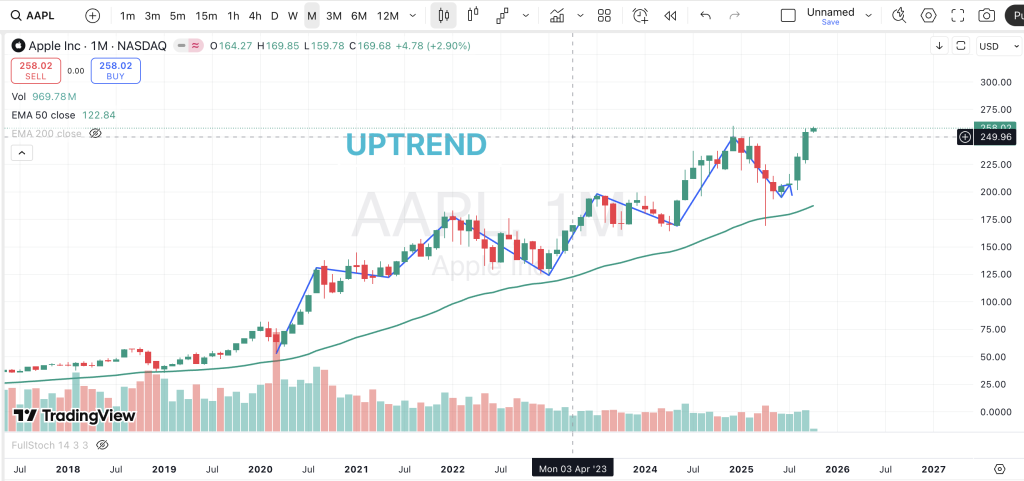
3. Uptrend – The Bullish Market Structure
🔎 Definition:
An uptrend is formed when price consistently makes:
- Higher Highs (HH) – Each new peak is higher than the previous one.
- Higher Lows (HL) – Each dip is higher than the previous dip.
This shows that buyers are pushing price upward and demand is strong.
📊 Example: Apple Trading View Chart
✅ How to Trade an Uptrend:
- Buy the Higher Lows: Wait for the pullback and enter near support.
- Use Trendline Support: Draw a trendline below the higher lows — price often respects it.
- Trail Your Stoploss: As price makes new highs, move your stoploss below each higher low.
📌 Pro Tip: Don’t chase candles. Wait for a pullback to structure support — that’s where risk-reward is strongest.
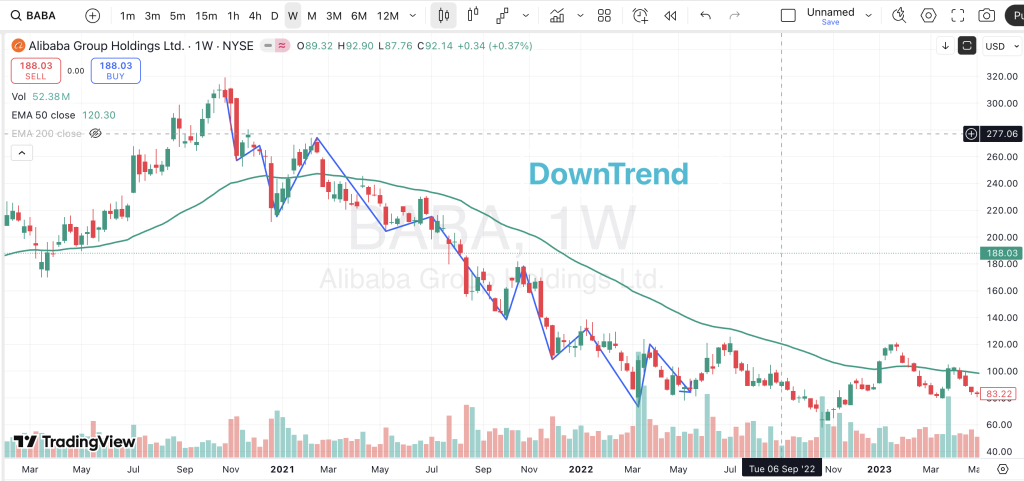
4. Downtrend – The Bearish Market Structure
🔎 Definition:
A downtrend is formed when price consistently makes:
- Lower Highs (LH) – Each peak is lower than the previous one.
- Lower Lows (LL) – Each dip is lower than the previous dip.
This shows sellers are in control and supply is strong.
📊 Example: Alibaba Tradingview chart
✅ How to Trade a Downtrend:
- Sell the Lower Highs: Wait for a pullback to resistance.
- Use Trendline Resistance: Draw a descending trendline to guide entries.
- Set Tight Stoploss: Above the recent lower high.
📌 Pro Tip: Don’t try to catch bottoms. Trade with the trend until structure breaks.
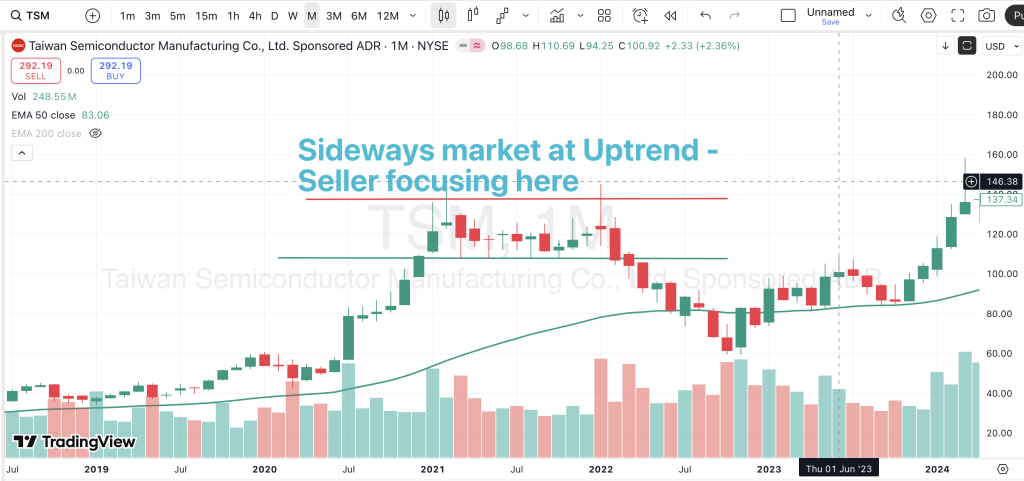
5. Sideways Market – Range-Bound Structure
🔎 Definition:
A range is formed when price moves horizontally between support and resistance without making higher highs or lower lows. It means buyers and sellers are balanced.
📊 Example: TSMC
Example 2: SONY
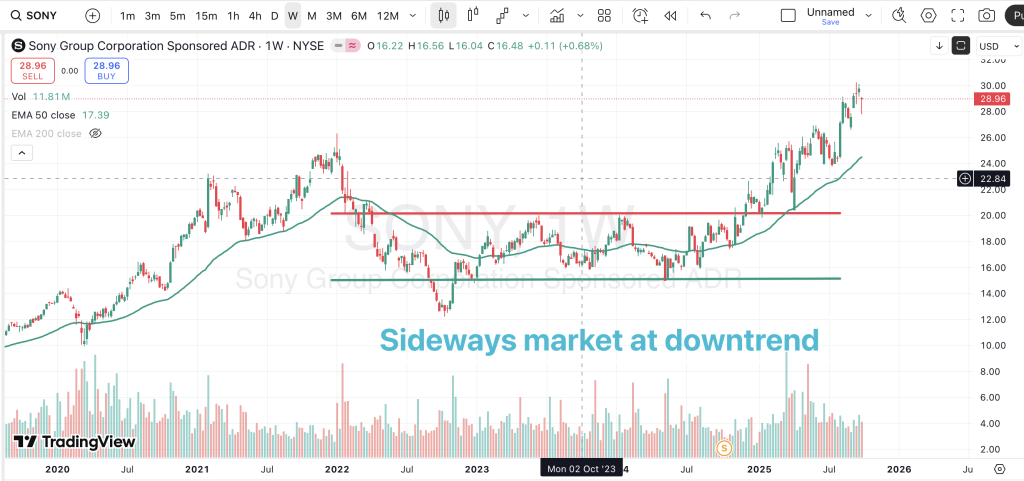
✅ How to Trade a Range:
- Buy Support / Sell Resistance: Range trading works best for short-term trades.
- Wait for Breakout: If volume confirms breakout, trend structure begins.
- Be Quick: Ranges are ideal for intraday or short swing trades.
📌 Pro Tip: Most big moves start with a long period of consolidation. Ranges are not boring — they’re often the calm before a storm.
6. Identifying Market Structure – Step by Step
- Mark Swing Highs & Lows: Connect recent peaks and dips.
- Observe Sequence:
- HH + HL → Uptrend
- LH + LL → Downtrend
- HH ≈ LH and HL ≈ LL → Range
- Draw Support & Resistance: Helps confirm structure boundaries.
- Watch for Break of Structure: A new high in a downtrend or new low in an uptrend = potential reversal.
7. Trading Strategies Based on Structure
📈 Trend-Following Strategy
- Identify a strong uptrend (HH + HL).
- Enter on pullback near support.
- Exit near previous high or next resistance.
📉 Trend Reversal Strategy
- Watch for structure shift (covered deeply in Part 3B).
- Entry after first higher high in a downtrend or lower low in an uptrend.
📊 Range Breakout Strategy
- Trade breakout with strong volume.
- Entry on retest of breakout zone.
- Set stoploss inside the range.
8. Pro Tips (From Real Traders)
💡 Tip 1: “Trade the structure, not your emotions.” If price is trending up, don’t short.
💡 Tip 2: The longer the consolidation, the bigger the breakout.
💡 Tip 3: Avoid over-analyzing small timeframes — structure is clearest on higher timeframes.
💡 Tip 4: Combine structure with volume — it tells you the strength of the move.
9. Mistakes Beginners Make
❌ Entering trades without identifying the current structure.
❌ Fighting the trend just because a candle “looks weak.”
❌ Trading every range breakout without volume confirmation.
❌ Ignoring higher timeframes — which often show the real structure.
10. Real-World Case Study – Bank Nifty
In 2022, Bank Nifty consolidated between ₹34,000 and ₹36,000 for weeks. Beginners thought the market was dead.
But professionals knew: long consolidations often lead to explosive moves.
When price finally broke above ₹36,000 with volume:
- Pullback to ₹36,100 offered a low-risk entry.
- Trend continued till ₹42,000 — a 6000-point rally.
📌 Lesson: Structure tells you the story before indicators do.
Conclusion
Market structure is the language of price action. It reveals the underlying battle between buyers and sellers and helps you anticipate what’s next.
Whether the market is trending, consolidating, or reversing — understanding structure allows you to trade with confidence, not confusion.
👉 Remember: “Trade in the direction of structure. Trade when structure aligns. Structure is the edge.”
In the next part (3B), we’ll go deeper into Market Structure Shifts (BOS/CHoCH) — the secret tool smart money uses to catch reversals before they happen.
❓ FAQ Section
1. What is market structure in trading?
Market structure is the pattern of price movement formed by buyers and sellers, showing trends, ranges, and potential reversals.
2. How do you identify a trend?
A trend is identified by the sequence of highs and lows — higher highs and higher lows for an uptrend, lower highs and lower lows for a downtrend.
3. Can you trade in a range-bound market?
Yes. Traders buy near support and sell near resistance in ranges. However, many prefer to wait for a breakout.
4. Why is market structure important?
It gives traders a clear understanding of who is in control (buyers or sellers), helps predict future price movement, and improves trade timing.